


Glass themes for Shiny, built on bslib. Add translucent surfaces, live light/dark switching, and adjustable glass intensity to your app.
Documentation · Theming guide · Release notes
CRAN 0.4.0:
install.packages("shinyglass")Development builds (GitHub):
# install.packages("remotes")
remotes::install_github("ericrayanderson/shinyglass")library(shiny)
library(shinyglass)
ui <- glass_page(
title = "Hello, glass",
persist = TRUE,
scene = "tahoe",
sliderInput("n", "Bars", 5, 30, 15),
plotOutput("plot")
)
server <- function(input, output, session) {
observe_glass(input, session)
output$plot <- renderPlot({
pal <- glass_plot_colors(input = input)
barplot(seq_len(input$n), col = pal$fill, border = NA, col.axis = pal$ink)
}, bg = "transparent")
}
shinyApp(ui, server)glass_page() includes Light / Dark / Auto, the intensity
slider, and accent wells. Set persist = TRUE (the default
here) to remember those choices.
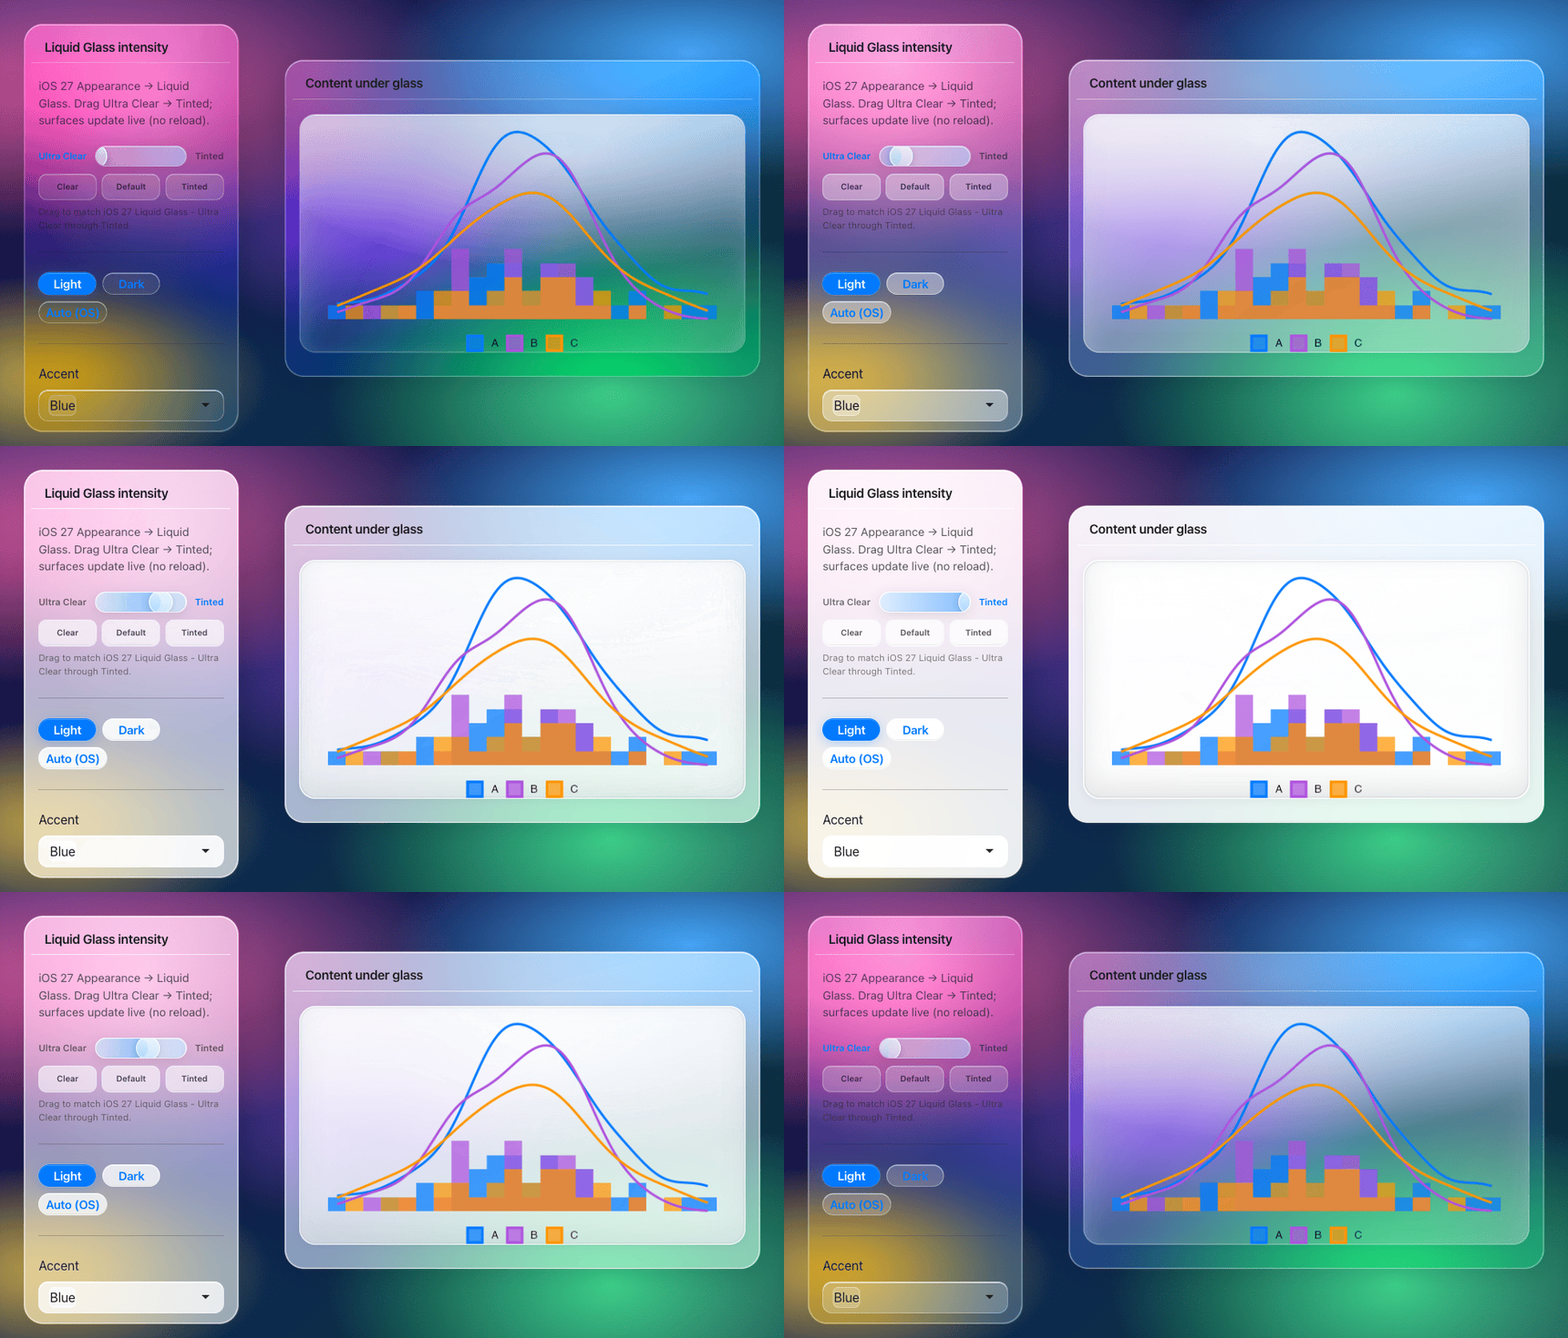
The intensity slider mirrors iOS 27 Settings → Appearance → Liquid Glass (continuous Ultra Clear → Tinted). Browsers cannot read that OS slider, so the in-app control is the supported way to match the look.
Dense charts and tables can opt into a regular panel with
glass_theme(plot_surface = "opaque") while nav and controls
stay on glass. The default "clear" look still shows the
wallpaper through plot hosts. Use
glass_plot_surface_input() to toggle live (ggplot / plotly
/ gt / DT).
Named wallpaper scenes (tahoe, dusk,
mesh, aurora, harbor,
grove) and optional wallpaper= photos stay
behind a blur + wash so text meets the contrast floor. For chromote,
PDF, or screenshots, call glass_flatten() or open the app
with ?glass_flatten=1.
Power users can read glass_css_tokens() and override
--glass-* variables with
glass_theme(tokens = list(blur = "28px")) without forking
SCSS.
Apps may take a moment to wake up.
| Demo | Explore |
|---|---|
| Basics | Theme switching and core controls |
| Dashboard | Cards, plots, and tables |
| Inputs | Shiny input controls |
| Olympic medals | A complete dashboard |
| plotly + gt | Interactive charts and tables |
Built for Bootstrap 5 and bslib. See compatibility for supported widgets and older layouts.
More: examples · experimental Python package · testing · deployment