
![]()
![]()
![]()
![]()
![]()
AIDA provides tools for the analysis of
interval-valued data, including construction, visualization, robust
estimation, and outlier detection. The R package is built around the
intData class and is designed to support methodological
research and applied workflows involving interval-valued data.
AIDA currently includes functionality for:
You can install the development version from GitHub:
# install.packages("pak")
pak::pak("catarinaploureiro/AIDA")library(AIDA)
#>
#> Attaching package: 'AIDA'
#> The following object is masked from 'package:base':
#>
#> rbind
# Create an intData object from the iris dataset, using the Species column as
# grouping variable. We also specify the latent distribution as "General" to
# estimate the parameters based on the microdata.
data(iris)
iris_int <- micro2intData(iris[,1:4], iris$Species, LatentCase = "General")
# Check the parameters of the latent distribution
iris_int@LatentParam
#> [[1]]
#> [,1] [,2] [,3] [,4]
#> [1,] 0.1835903 0.1554921 0.1660354 0.1990067
#> [2,] 0.1554921 0.1381013 0.1461729 0.1683492
#> [3,] 0.1660354 0.1461729 0.1627440 0.1828199
#> [4,] 0.1990067 0.1683492 0.1828199 0.2704900
#>
#> [[2]]
#> [,1] [,2] [,3] [,4]
#> [1,] 0.01851852 0.00000000 0.00000000 0.0000000
#> [2,] 0.00000000 0.04199507 0.00000000 0.0000000
#> [3,] 0.00000000 0.00000000 0.02913753 0.0000000
#> [4,] 0.00000000 0.00000000 0.00000000 -0.1802821
# Compute the classical covariance and correlation matrices
iris_cov <- int_cov(iris_int)
iris_corr <- cov2cor(iris_cov)
# Pairs plot, the lower triangular shows scatter plots of the four variables,
# while the upper triangular shows the interval correlation matrix.
plot_pairs_int(iris_int, corr = iris_corr, labels = colnames(iris_int))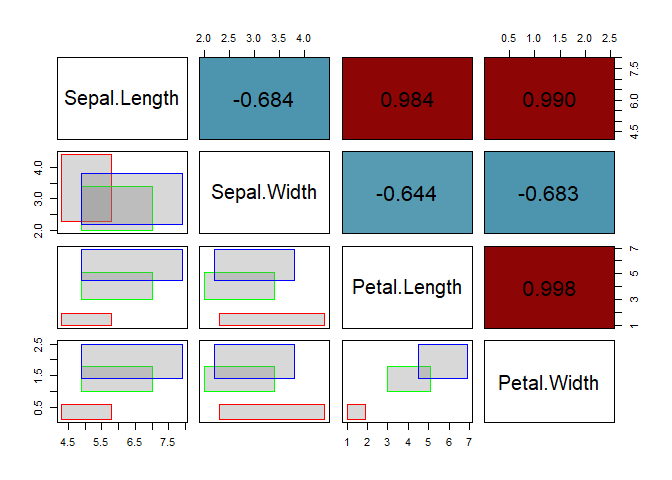
For a full introduction about the intData class
(Oliveira, Pinheiro, and Oliveira (2025)), see:
vignette("intData_examples", package = "AIDA")For examples on the IMCD estimator and outlier detection based on the robust squared Interval-Mahalanobis distance (Loureiro et al. (2026b)), see:
vignette("IMCD_examples", package = "AIDA")For examples on explainable outlier detection using Shapley values (Loureiro et al. (2026a)), see:
vignette("Shapley_examples", package = "AIDA")