![]()
This R package implements the Mapper algorithm for topological data analysis (TDA). The Mapper algorithm facilitates visualisation and analysis of high-dimensional data by constructing a simplicial complex that represents the underlying structure of the data. The package offers both the standard Mapper, F-Mapper, and G-Mapper algorithms, in addition to multiple clustering methods and visualisation tools.
For a more detailed explanation for this package, this document will keep update for better understanding the source code. I’ve written some articles on Medium, which you can find here to get familiar with topological data analysis.
 Step visualize from
Skaf et al.
Step visualize from
Skaf et al.
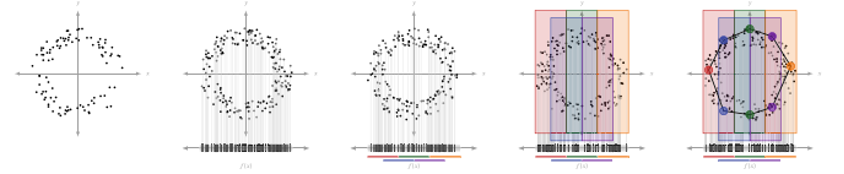
Mapper is basically a three-step process:
1. Cover: This step splits the data into overlapping intervals and creates a cover for the data.
2. Cluster: This step clusters the data points in each interval the cover creates.
3. Simplicial Complex: This step combines the two steps above, which connects the data points in the cover to create a simplicial complex.
you can know more about the basic here: Chazal, F., & Michel, B. (2021). An introduction to topological data analysis: fundamental and practical aspects for data scientists. Frontiers in artificial intelligence, 4, 667963.
data <- get(data("iris"))

Mapper <- MapperAlgo(
  data[,1:4],
  filter_values = data[,1:3],
  percent_overlap = 20,
  methods = "kmeans",
  method_params = list(max_kmeans_clusters = 2),
  cover_type = 'stride',
  interval_width = 1,
  num_cores = 12
  )
FMapper <- FuzzyMapperAlgo(
  original_data = data[,1:4],
  filter_values =  data[,1:2],
  cluster_n = 8,
  fcm_threshold = 0.2,
  methods = "kmeans",
  method_params = list(max_kmeans_clusters = 2)
)
GMapper <- GMapperAlgo(
  data[,1:4],
  filter_values = data[,1],
  AD_threshold = 0.8,
  g_overlap = 0.5,
  methods = "kmeans",
  method_params = list(max_kmeans_clusters = 2),
  num_cores = 12
)

MapperPlotter(Mapper, label=data$Species, original_data=data, avg=FALSE, use_embedding=FALSE)
MapperPlotter(FMapper, label=data$Species, original_data=data, avg=FALSE, use_embedding=FALSE)
MapperPlotter(GMapper, label=data$Species, original_data=data, avg=FALSE, use_embedding=FALSE)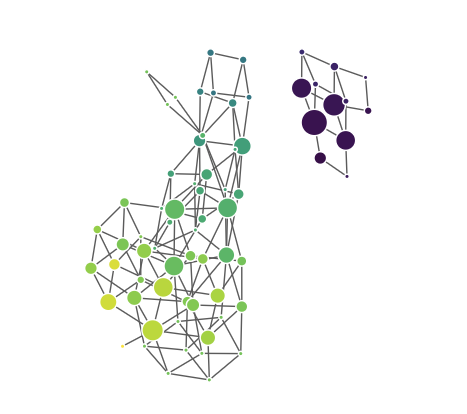 |
 |
 |
|---|---|---|
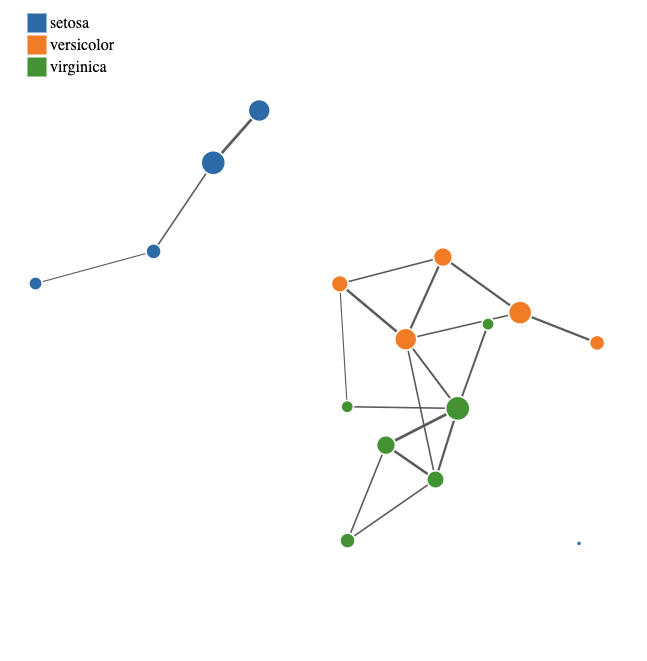
| Mapper | F-Mapper | G-Mapper |
The frontend is still under testing but has been deployed to tda frontend. To visualise
your own data, upload a JSON file formatted as shown below. The
cc is optional; you can ignore it unless you have
pre-calculated labels.
library(jsonlite)

export_data <- list(
  adjacency = Mapper$adjacency,
  num_vertices = Mapper$num_vertices,
  level_of_vertex = Mapper$level_of_vertex,
  points_in_vertex = Mapper$points_in_vertex,
  original_data = as.data.frame(all_features),
  # This is the label that already calculated for each node (optional)
  cc = tibble(
    eigen_centrality = e_scores,
    betweenness = b_scores
  )
)
write(toJSON(export_data, auto_unbox = TRUE), "~/desktop/frontend.json")