RcppCensSpatial
packageThe RcppCensSpatial package fits spatial censored linear
regression models using the Expectation-Maximization (EM) (Dempster,
Laird, and Rubin 1977), Stochastic Approximation EM (SAEM) (Delyon,
Lavielle, and Moulines 1999), or Monte Carlo EM (MCEM) (Wei and Tanner
1990) algorithm. These algorithms are widely used to obtain maximum
likelihood (ML) estimates in the presence of incomplete data. The EM
algorithm can be applied when a closed-form expression for the
conditional expectation of the complete-data log-likelihood is
available. In the MCEM algorithm, this conditional expectation is
replaced by a Monte Carlo approximation based on multiple independent
simulations of the partially observed data. In contrast, the SAEM
algorithm decomposes the E-step into simulation and stochastic
approximation steps.
The package also provides approximate standard errors for the parameter estimates using the method proposed by Louis (1982), and it supports missing values in the response variable. In addition, it includes functions for spatial prediction at new locations, as well as for computing covariance and distance matrices. For further details on model formulation and estimation procedures, see Ordoñez et al. (2018) and Valeriano et al. (2021).
The RcppCensSpatial library provides the following
functions:
CovMat: computes the spatial covariance matrix.dist2Dmatrix: computes the Euclidean distance matrix
for a set of coordinates.EM.sclm: fits a spatial censored linear regression
model using the EM algorithm.MCEM.sclm: fits a spatial censored linear regression
model using the MCEM algorithm.SAEM.sclm: fits a spatial censored linear regression
model using the SAEM algorithm.predict.sclm: performs spatial prediction at a set of
new locations.rCensSp: simulates censored spatial data under a
specified censoring rate.The generic functions print, summary,
predict, and plot are also available for
objects of class sclm.
In the following sections, we describe how to install the package and demonstrate the use of its main functions through an artificial example.
The released version of RcppCensSpatial from CRAN can be installed with:
install.packages("RcppCensSpatial")In the following example, we simulate a dataset of size n = 220 from a spatial linear regression model with three covariates and an exponential correlation function to account for spatial dependence. To evaluate predictive performance, the dataset is split into training and testing sets. The training set consists of 200 observations, with 5% left-censored responses, while the test set contains the remaining 20 observations.
library(RcppCensSpatial)

set.seed(12341)
n = 220
x = cbind(1, runif(n), rnorm(n))
coords = round(matrix(runif(2*n, 0, 15), n, 2), 5)
dat = rCensSp(beta=c(1,2,-1), sigma2=1, phi=4, nugget=0.50, x=x, coords=coords,
              cens='left', pcens=.05, npred=20, cov.model="exponential")
# Proportion of censoring
table(dat$Data$ci)
#>
#>   0   1
#> 190  10
For comparison purposes, we fit the spatial censored linear model to
the simulated data using three approaches: the EM, MCEM, and SAEM
algorithms. Each method is run with the same maximum number of
iterations (MaxIter = 300) and uses the exponential spatial
correlation function (type = "exponential"), which is also
the default setting and was used in the data generation process.
Other available spatial correlation functions include
'matern', 'gaussian', and
'pow.exp'.
data1 = dat$Data

# EM estimation
fit1 = EM.sclm(data1$y, data1$x, data1$ci, data1$lcl, data1$ucl, data1$coords,
               phi0=3, nugget0=1, MaxIter=300)
fit1$tab
#>       beta0  beta1   beta2 sigma2    phi   tau2
#>      0.6959 1.7894 -0.9477 1.2032 4.3018 0.3824
#> s.e. 0.4848 0.2027  0.0592 0.5044 2.2872 0.0793

# MCEM estimation
fit2 = MCEM.sclm(data1$y, data1$x, data1$ci, data1$lcl, data1$ucl, data1$coords,
                 phi0=3, nugget0=1, MaxIter=300, nMax=1000)
fit2$tab
#>       beta0  beta1   beta2 sigma2    phi   tau2
#>      0.6952 1.7896 -0.9476 1.2069 4.3216 0.3828
#> s.e. 0.4868 0.2025  0.0592 0.5121 2.3144 0.0793

# SAEM estimation
fit3 = SAEM.sclm(data1$y, data1$x, data1$ci, data1$lcl, data1$ucl, data1$coords,
                 phi0=3, nugget0=1, M=10)
fit3$tab
#>       beta0  beta1   beta2 sigma2    phi   tau2
#>      0.6959 1.7883 -0.9471 1.2060 4.3207 0.3811
#> s.e. 0.4865 0.2021  0.0590 0.5096 2.3125 0.0791
Note that the parameter estimates obtained from each method are similar and generally close to the true values, except for the first regression coefficient, which is estimated to be approximately 0.70, whereas its true value is 1.
Moreover, the generic functions print and
summary provide detailed information about the fitted
sclm object, including parameter estimates, standard
errors, the effective range, information criteria, and convergence
diagnostics.
print(fit3)
#> ----------------------------------------------------------------
#> Spatial Censored Linear Regression Model
#> ----------------------------------------------------------------
#> Call:
#> SAEM.sclm(y = data1$y, x = data1$x, ci = data1$ci, lcl = data1$lcl,
#> ucl = data1$ucl, coords = data1$coords, phi0 = 3, nugget0 = 1,
#> M = 10)
#>
#> Estimated parameters:
#> beta0 beta1 beta2 sigma2 phi tau2
#> 0.6959 1.7883 -0.9471 1.2060 4.3207 0.3811
#> s.e. 0.4865 0.2021 0.0590 0.5096 2.3125 0.0791
#>
#> The effective range is 12.9436 units.
#>
#> Model selection criteria:
#> Loglik AIC BIC
#> Value -251.323 514.645 534.435
#>
#> Details:
#> Number of censored/missing values: 10
#> Convergence reached?: TRUE
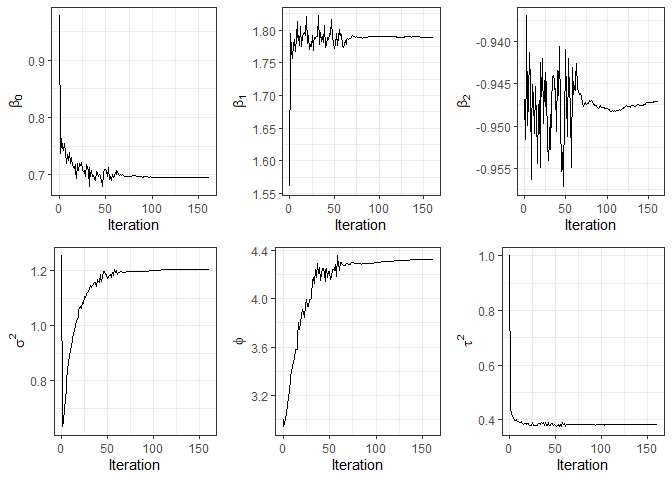
#> Iterations: 161 / 300
#> Processing time: 1.0391 minsAdditionally, the plot function can be used to visualize
convergence diagnostics of the parameter estimates.
plot(fit3)
Next, predicted values are obtained for each fitted model on the test data, and their mean squared prediction errors (MSPE) are compared.
data2 = dat$TestData
pred1 = predict(fit1, data2$coords, data2$x)
pred2 = predict(fit2, data2$coords, data2$x)
pred3 = predict(fit3, data2$coords, data2$x)

# Cross-validation
mean((data2$y - pred1$predValues)^2)
#> [1] 1.595305
mean((data2$y - pred2$predValues)^2)
#> [1] 1.591421
mean((data2$y - pred3$predValues)^2)
#> [1] 1.594899