
![]()
Tired of spending endless time customizing a causal process graph in
Word or trying to decipher the inner workings of the TikZ package in
LaTeX? The goal of causalplot is to create
publication-ready causal process plots using a simple convenience
function that demands almost nothing of the user and lets you focus your
attention on what actually matters—the theorizing. Users chose between
templates and add their own variable and mechanism labels, and the
package produces a causal plot. The package also allows for additional
customization in terms of text color, box color, fonts, and
captions.
Once published, you can install causalplot from CRAN
with:
install.packages("causalplot")Or install the development version from GitHub with:
# install.packages("devtools")
devtools::install_github("sebastianvanbaalen/causalplot")The latest version of causalplot includes several new
features and fixes:
Reduction of white space around the plots.
Support for causal plots with two independent variables
(templates 211, 221, and
2221).
Support for the standard 2x2 descriptive or explanatory typology.
An embedded Shiny app that allows users to make plots without
writing any code. Launch by typing causalplot::run_app() or
visit https://sebvanbaalen.shinyapps.io/causalplot.
Are you missing a template or is something not running as it should? Make a new issue in the Github repository or email Sebastian at sebastian.van-baalen@pcr.uu.se.
Making a causal diagram using causalplot is easy. All
you need is an idea, your variable names, and labels for your causal
mechanisms or causal process steps. Use the type argument
to chose between different templates in the plot gallery. Below is the
code for making the simplest plot consisting only of three boxes: one
for the independent variable, one for the dependent variable, and one
for the causal mechanism.
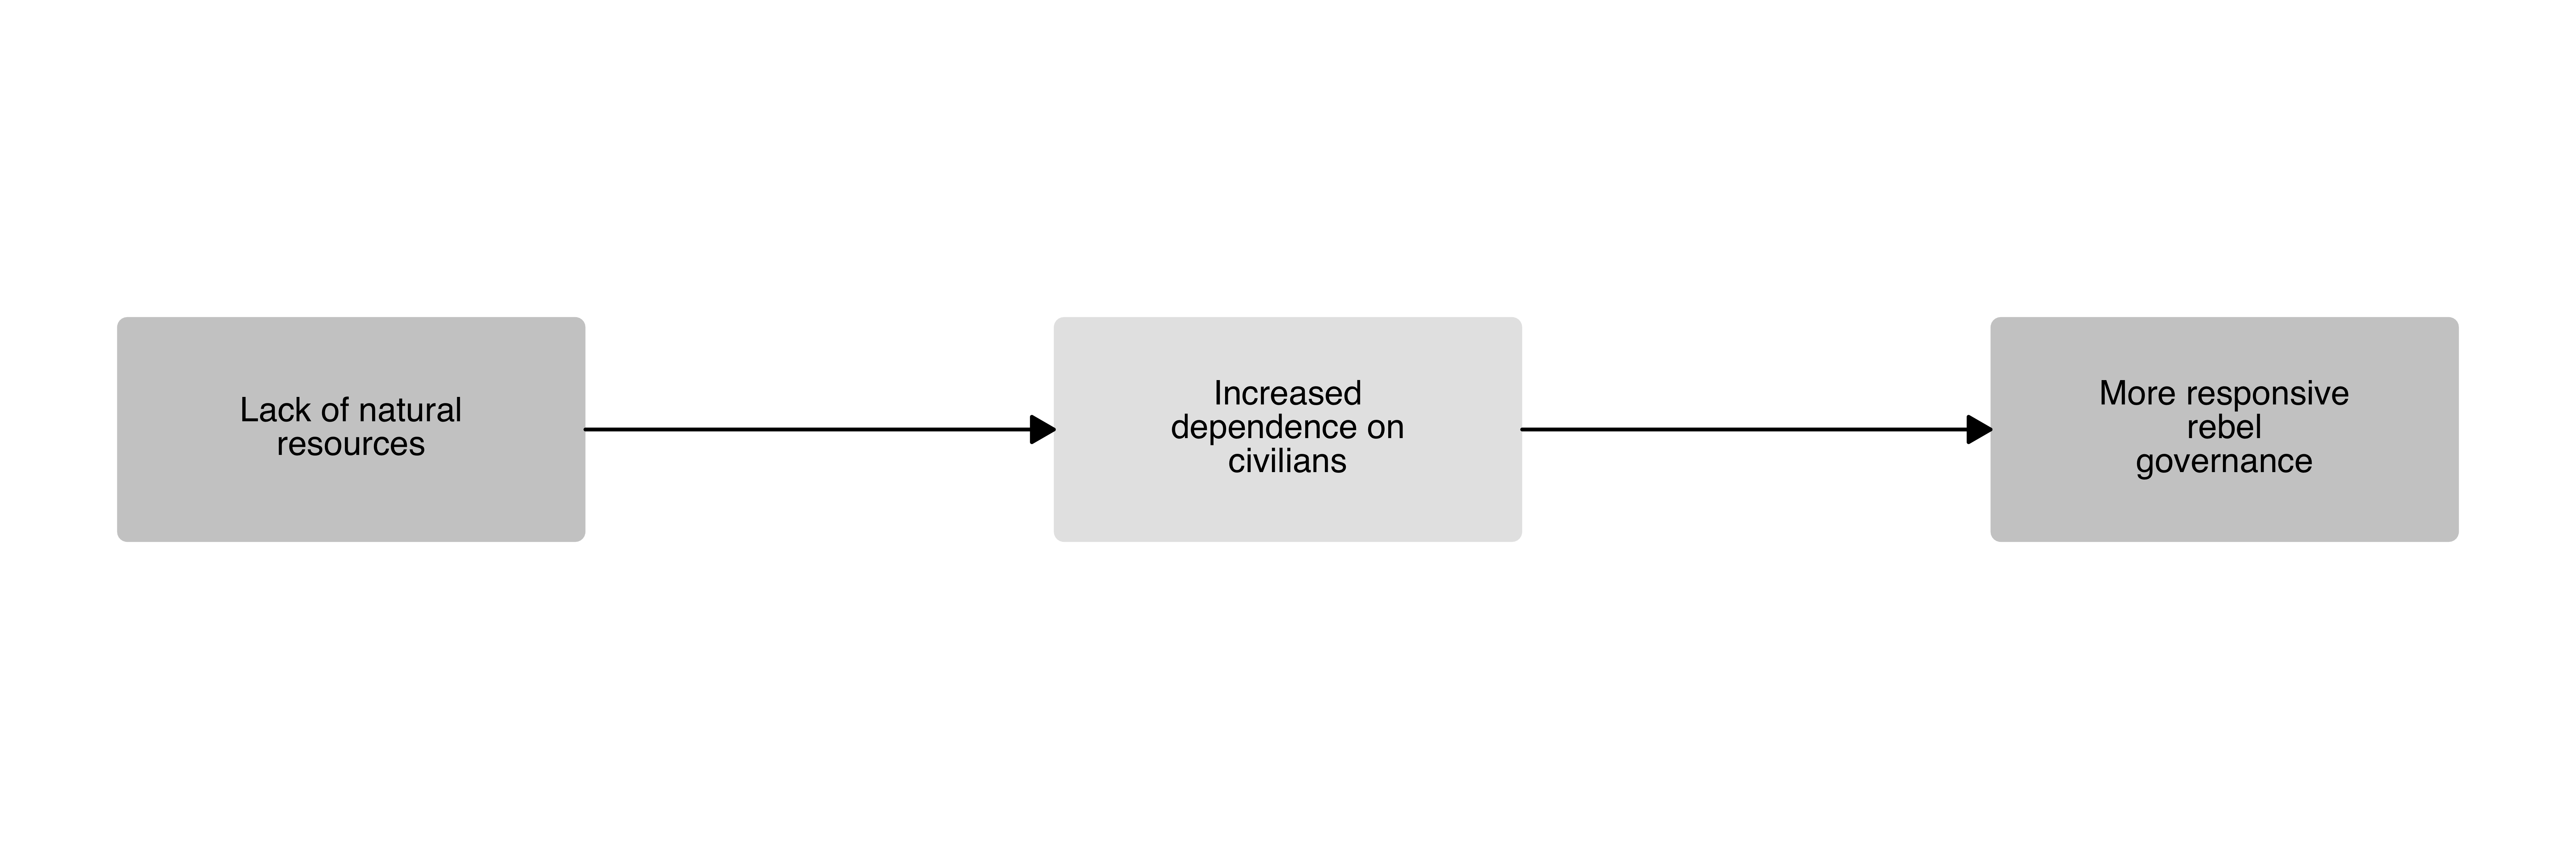
causal_plot(
  type = "111",
  labels = c(
    "Lack of natural resources",
    "Increased dependence on civilians",
    "More responsive rebel governance"
  ),
  wrap_width = 16
)
causalplot includes several different templates and
requires no manual definition of nodes and arrows, simplifying the
plotting experience. Below is an overview of all available templates, as
well as examples of how to customize the plots. Feel free to reach out
if you are missing a particular set-up.
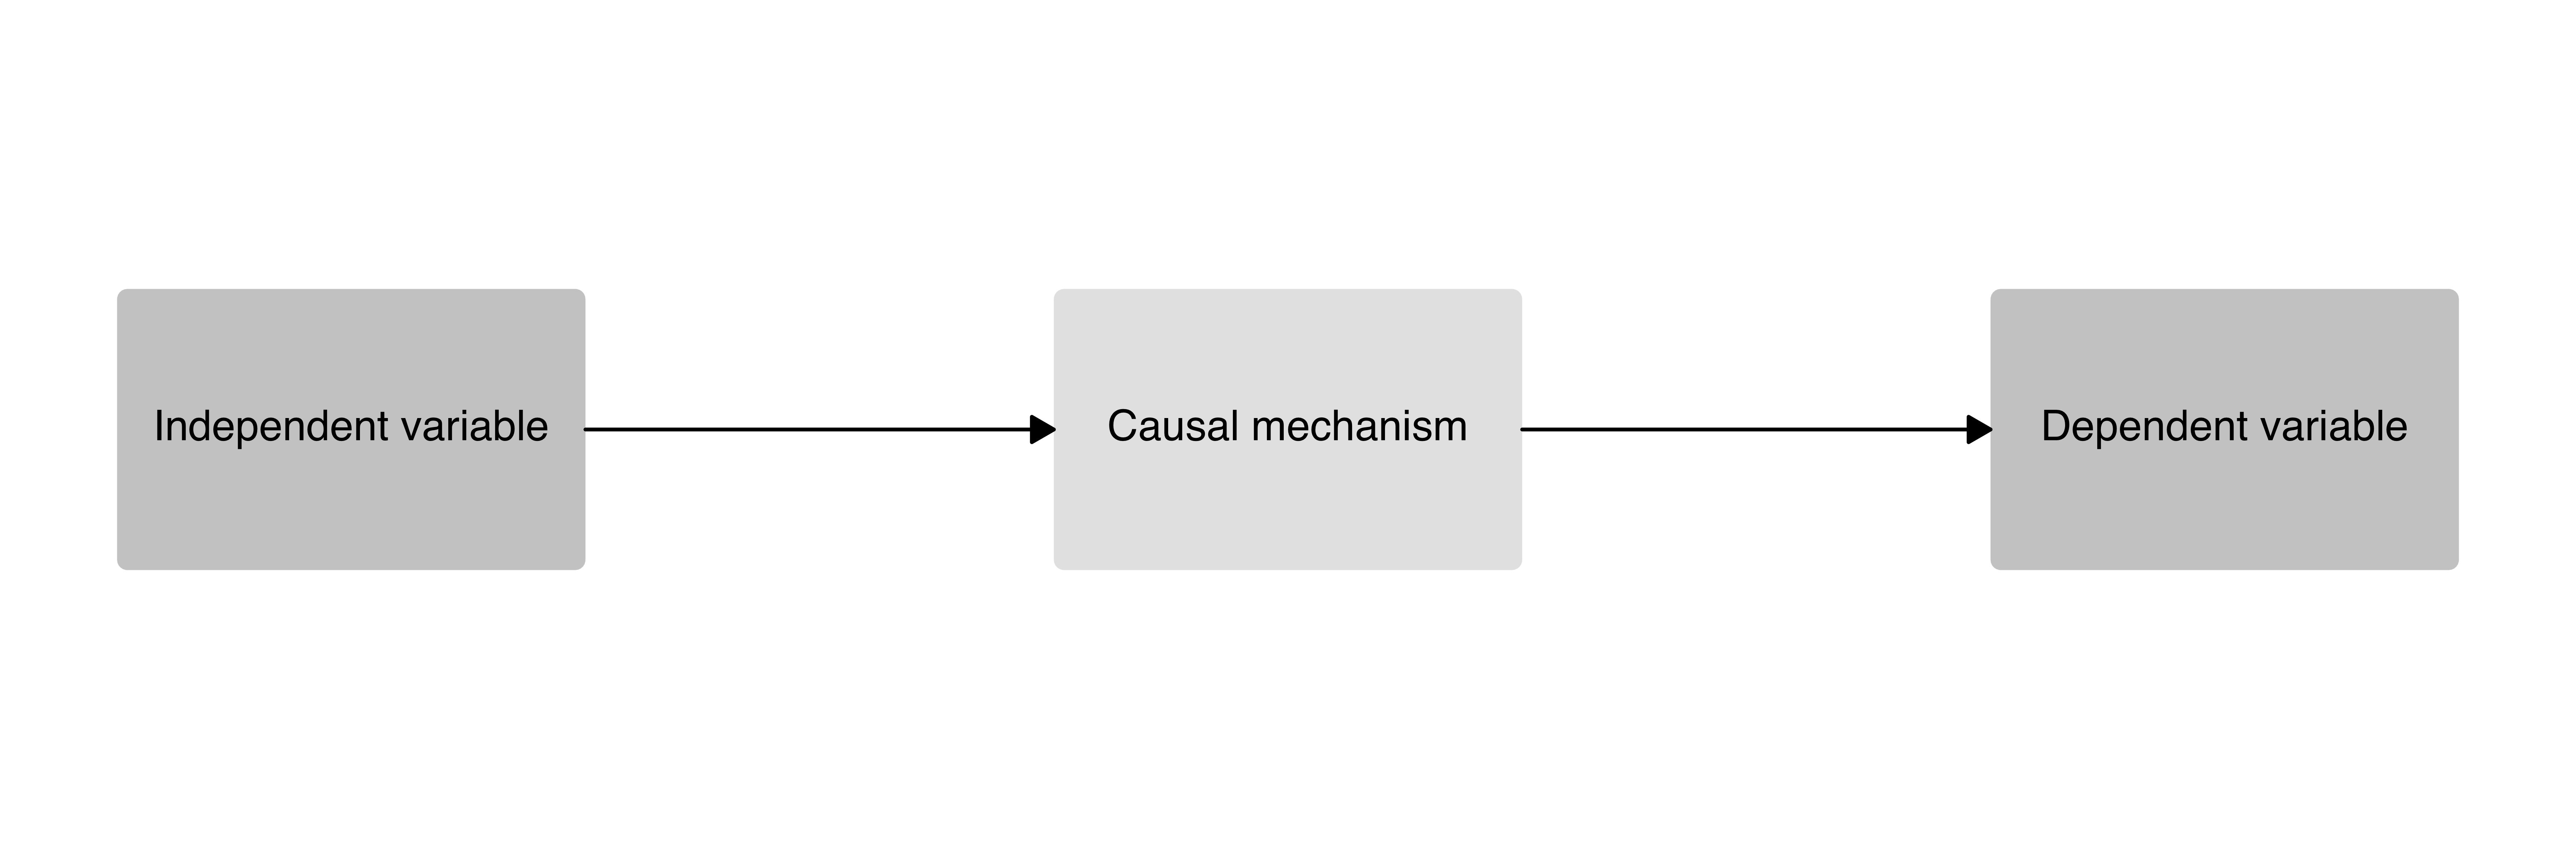
A simple one-step causal mechanism plot with an independent variable, dependent variable, and one causal mechanism box.
causal_plot(
  type = "111", # Chose the plot template
  text_size = 5, # Set the text size
  box_ratio = 1 # Increase the box height
)
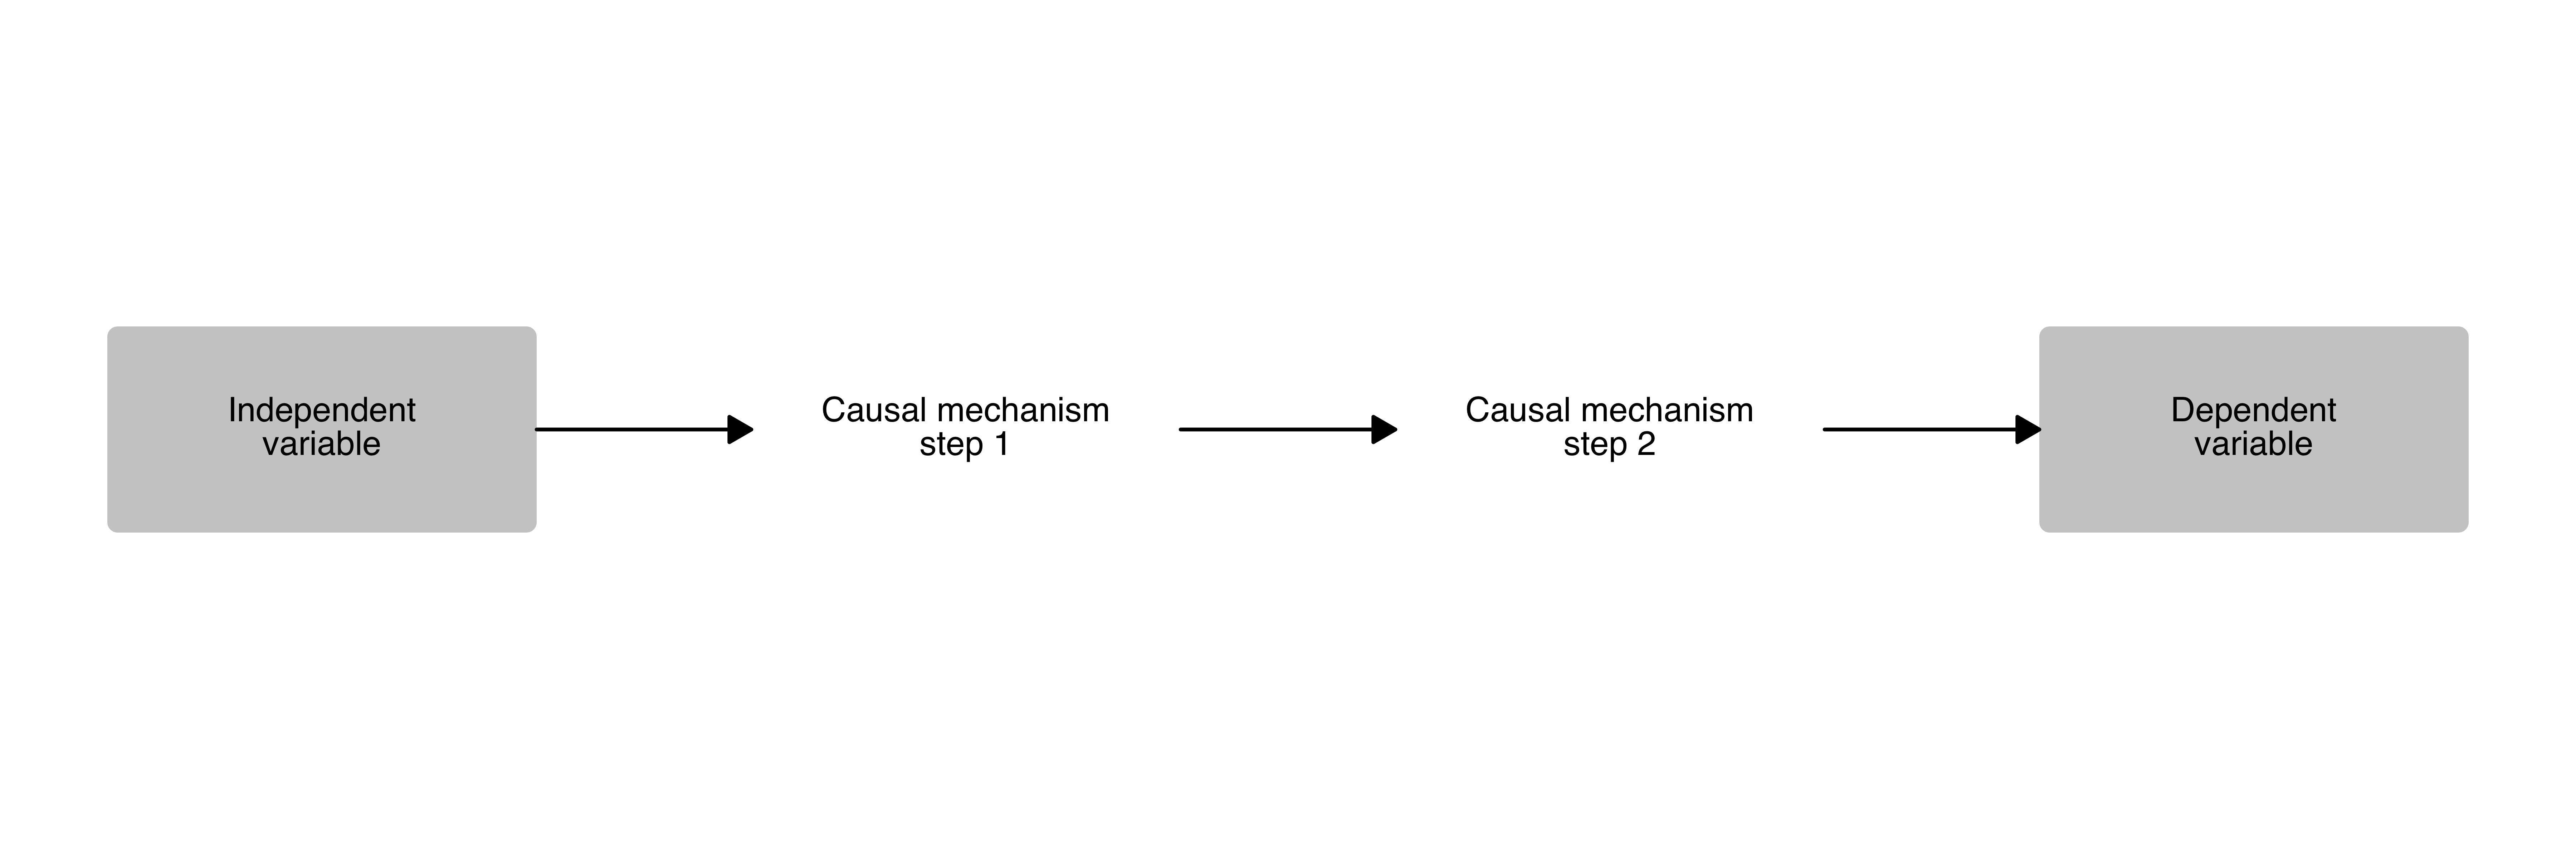
A two-step causal mechanism plot with an independent variable, dependent variable, and two causal process boxes.
causal_plot(
  type = "1111",
  text_size = 4,
  wrap_width = 17, # Set the number of characters before line skip
  fill_mechanisms = "white" # Set the color of the process boxes
)
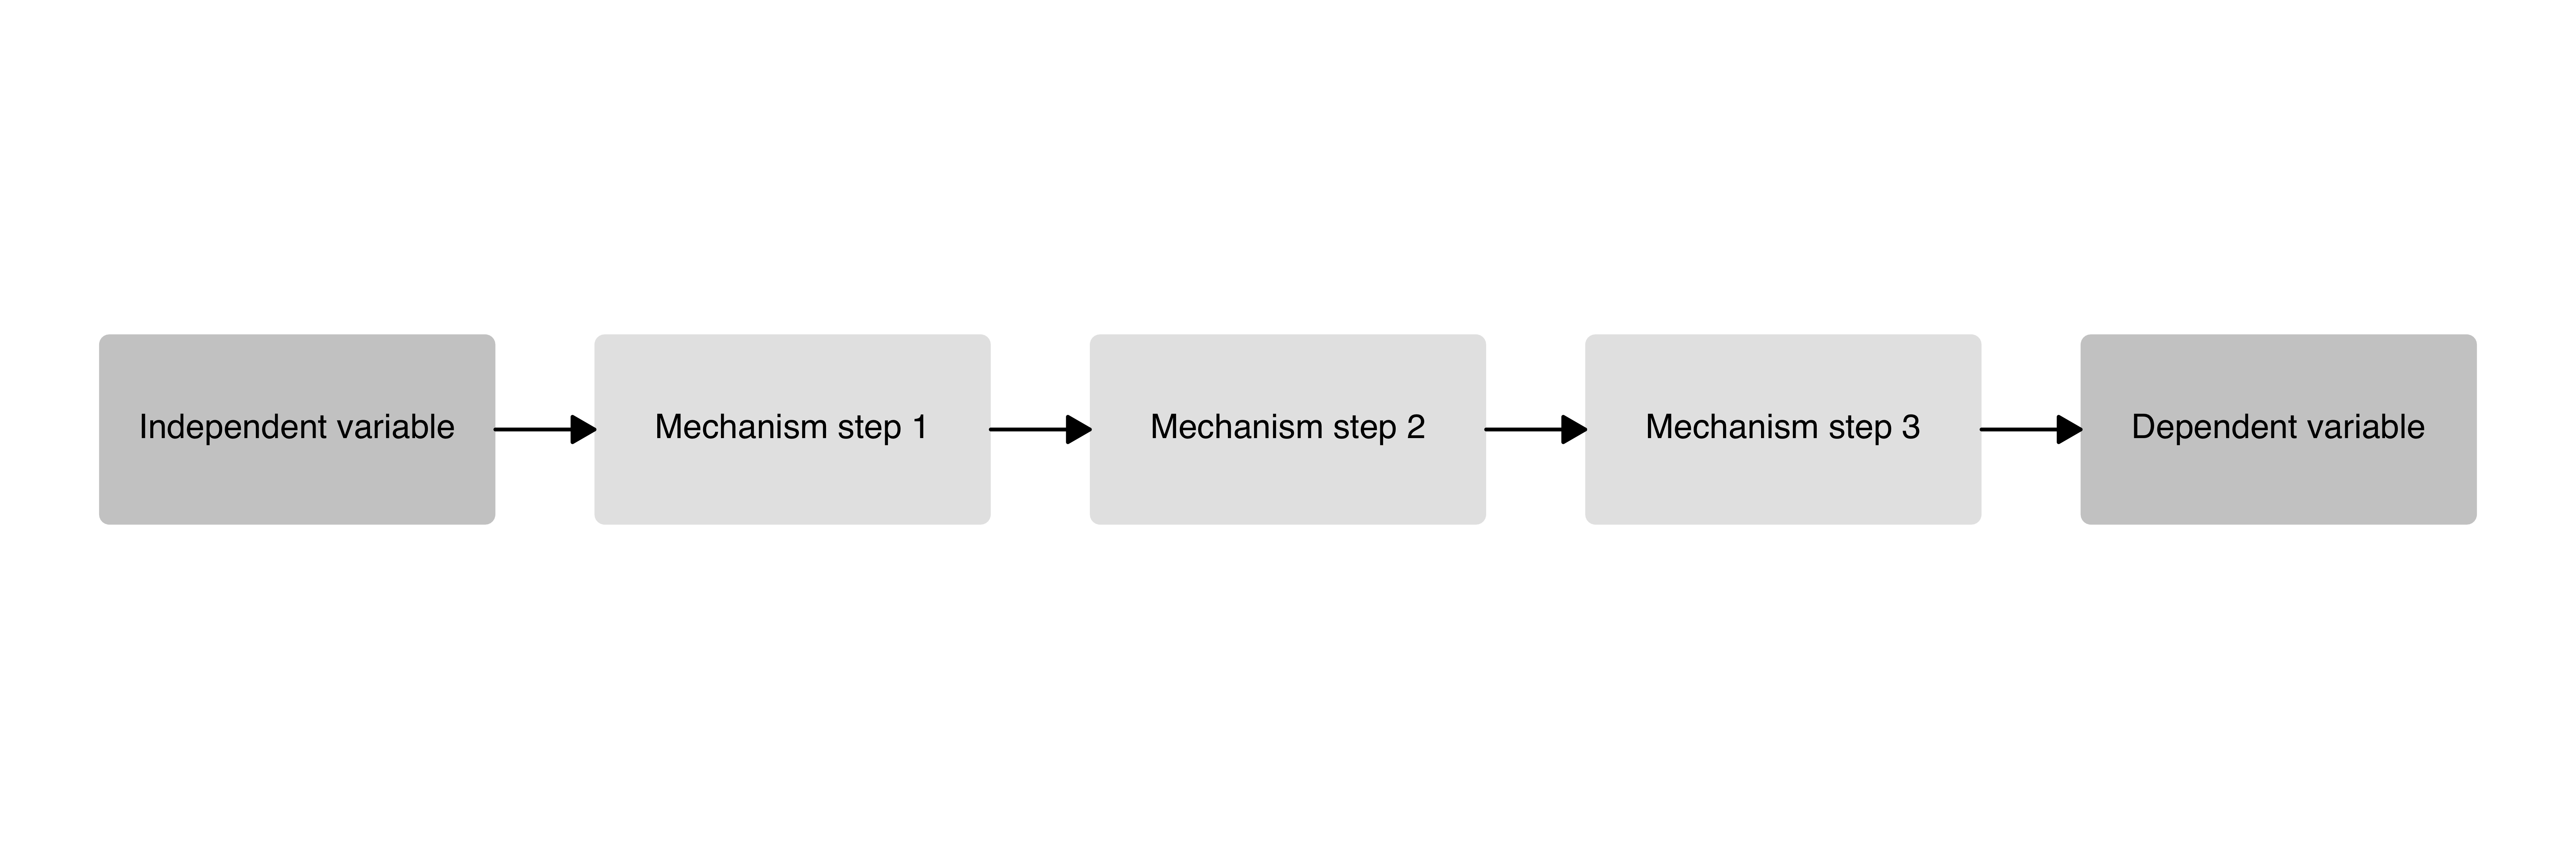
A three-step causal mechanism plot with an independent variable, dependent variable, and three causal process boxes.
causal_plot(
  type = "11111",
  text_size = 4
)
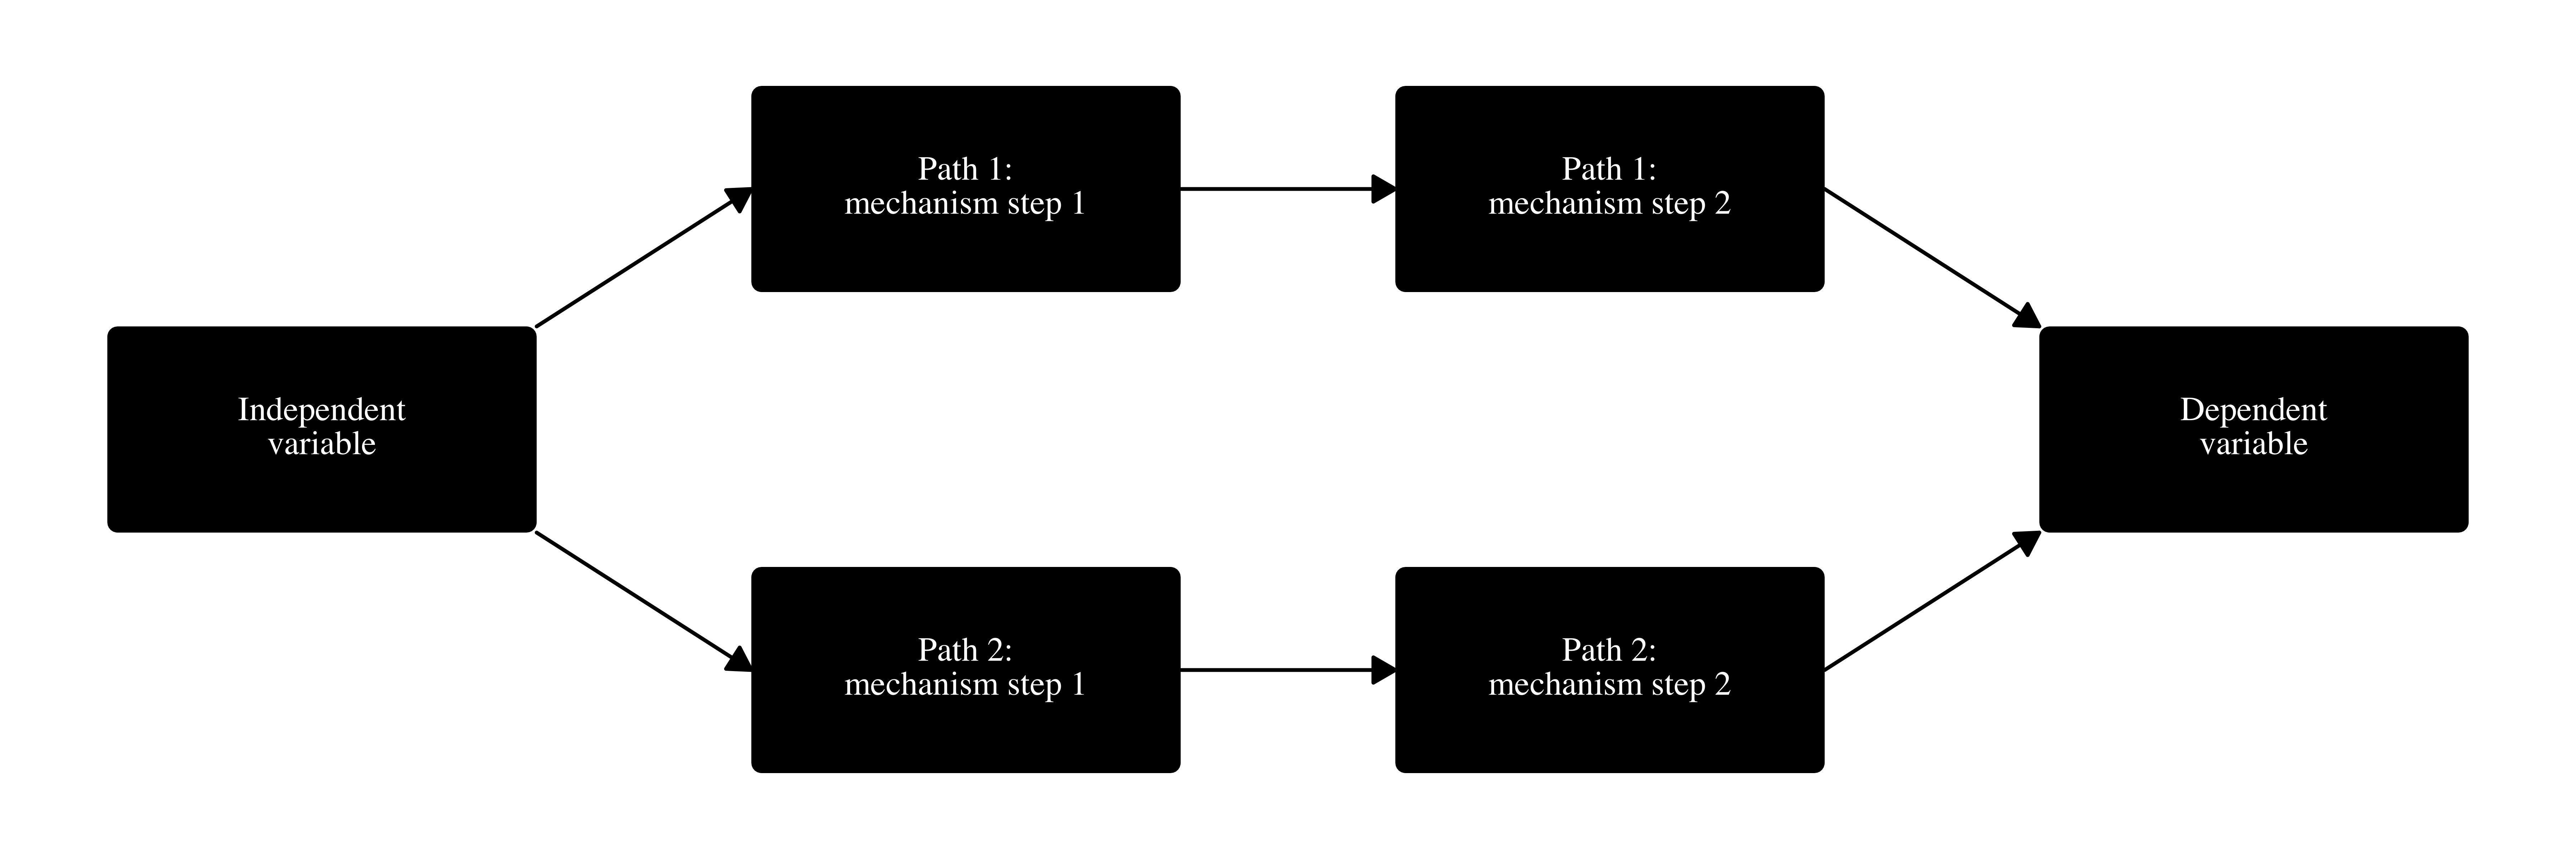
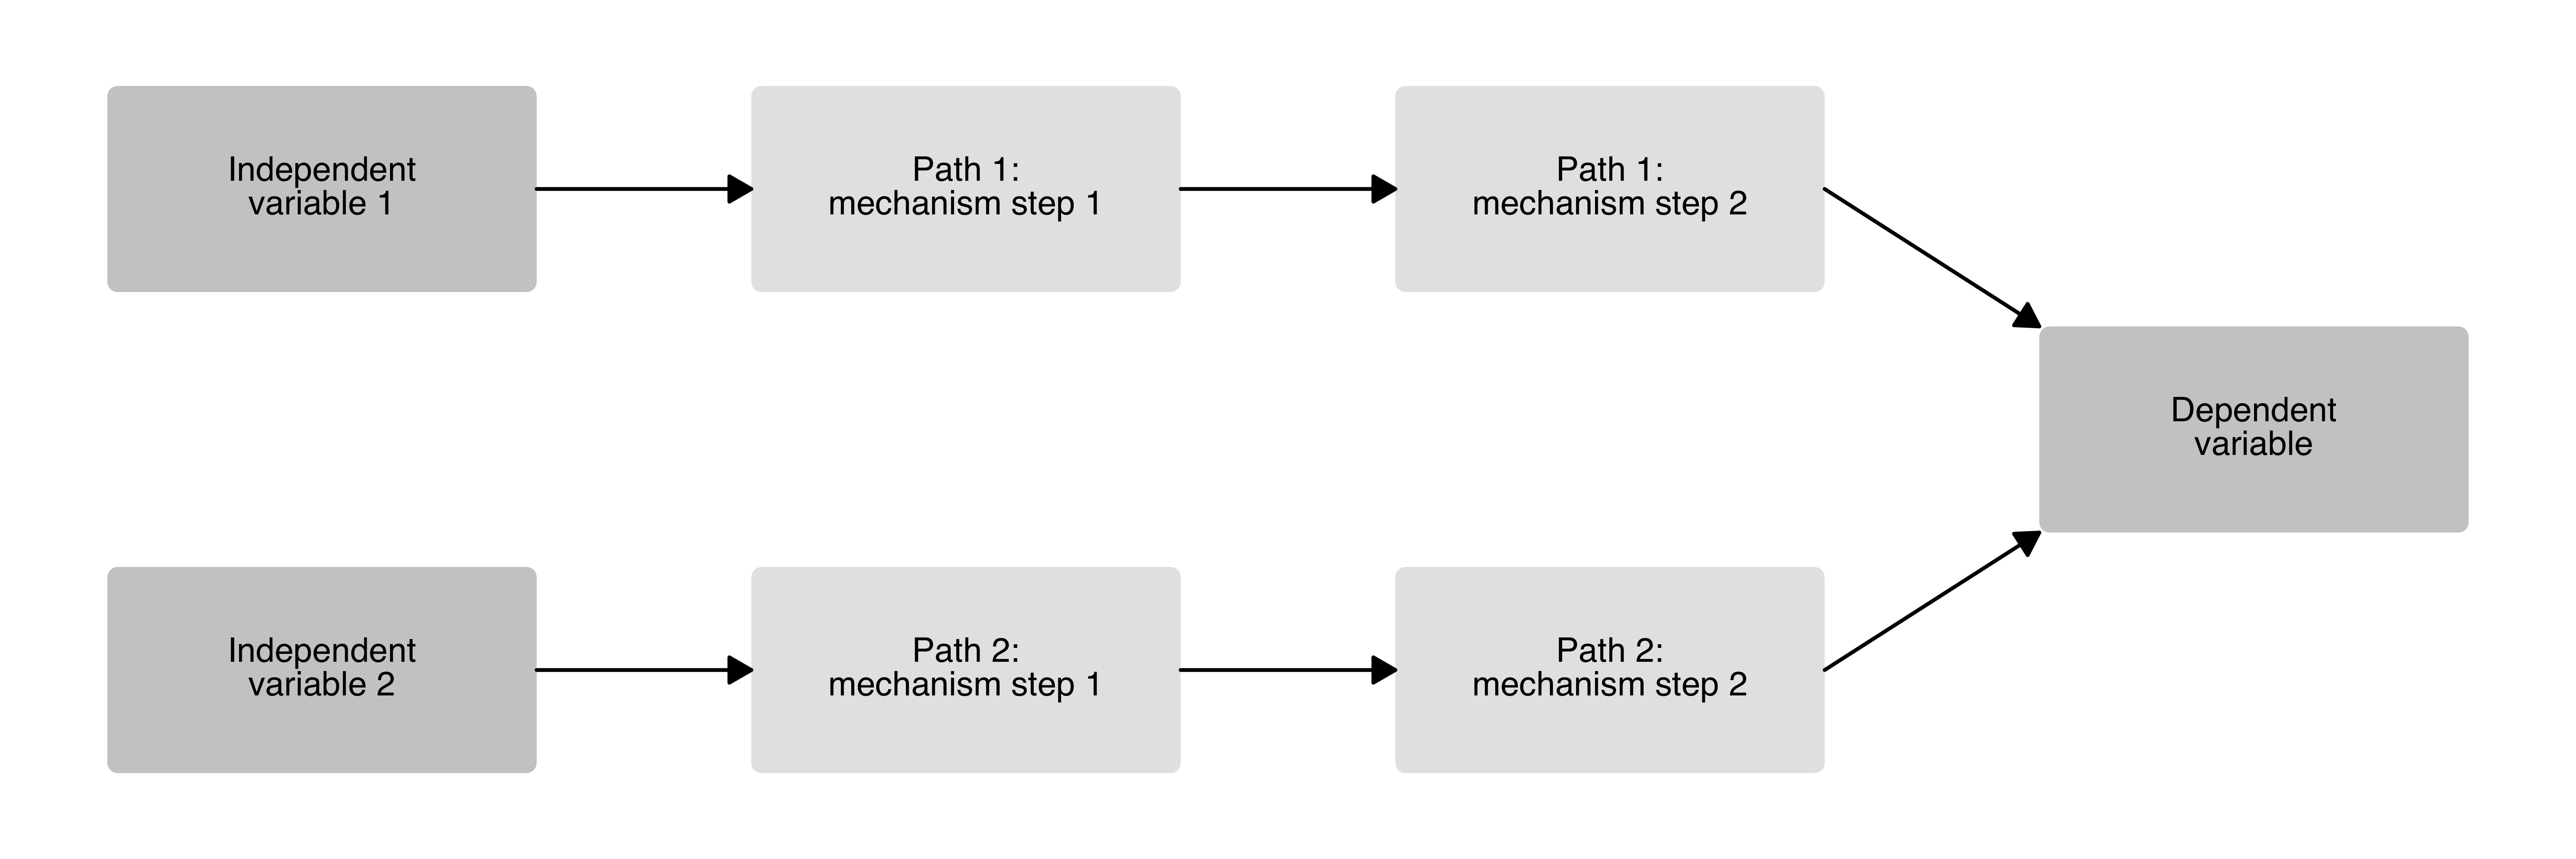
A two-step causal mechanism plot with an independent variable, dependent variable, and two separate causal pathways.
causal_plot(
  type = "1221",
  labels = c(
    "Independent variable",
    "Path 1: mechanism step 1",
    "Path 2: mechanism step 1",
    "Path 1: mechanism step 2",
    "Path 2: mechanism step 2",
    "Dependent variable"
  ),
  wrap_width = 17,
  text_size = 4,
  fill_mechanisms = "black",
  fill_variables = "black",
  text_color = "white",
  font = "Times" # Set the font
)
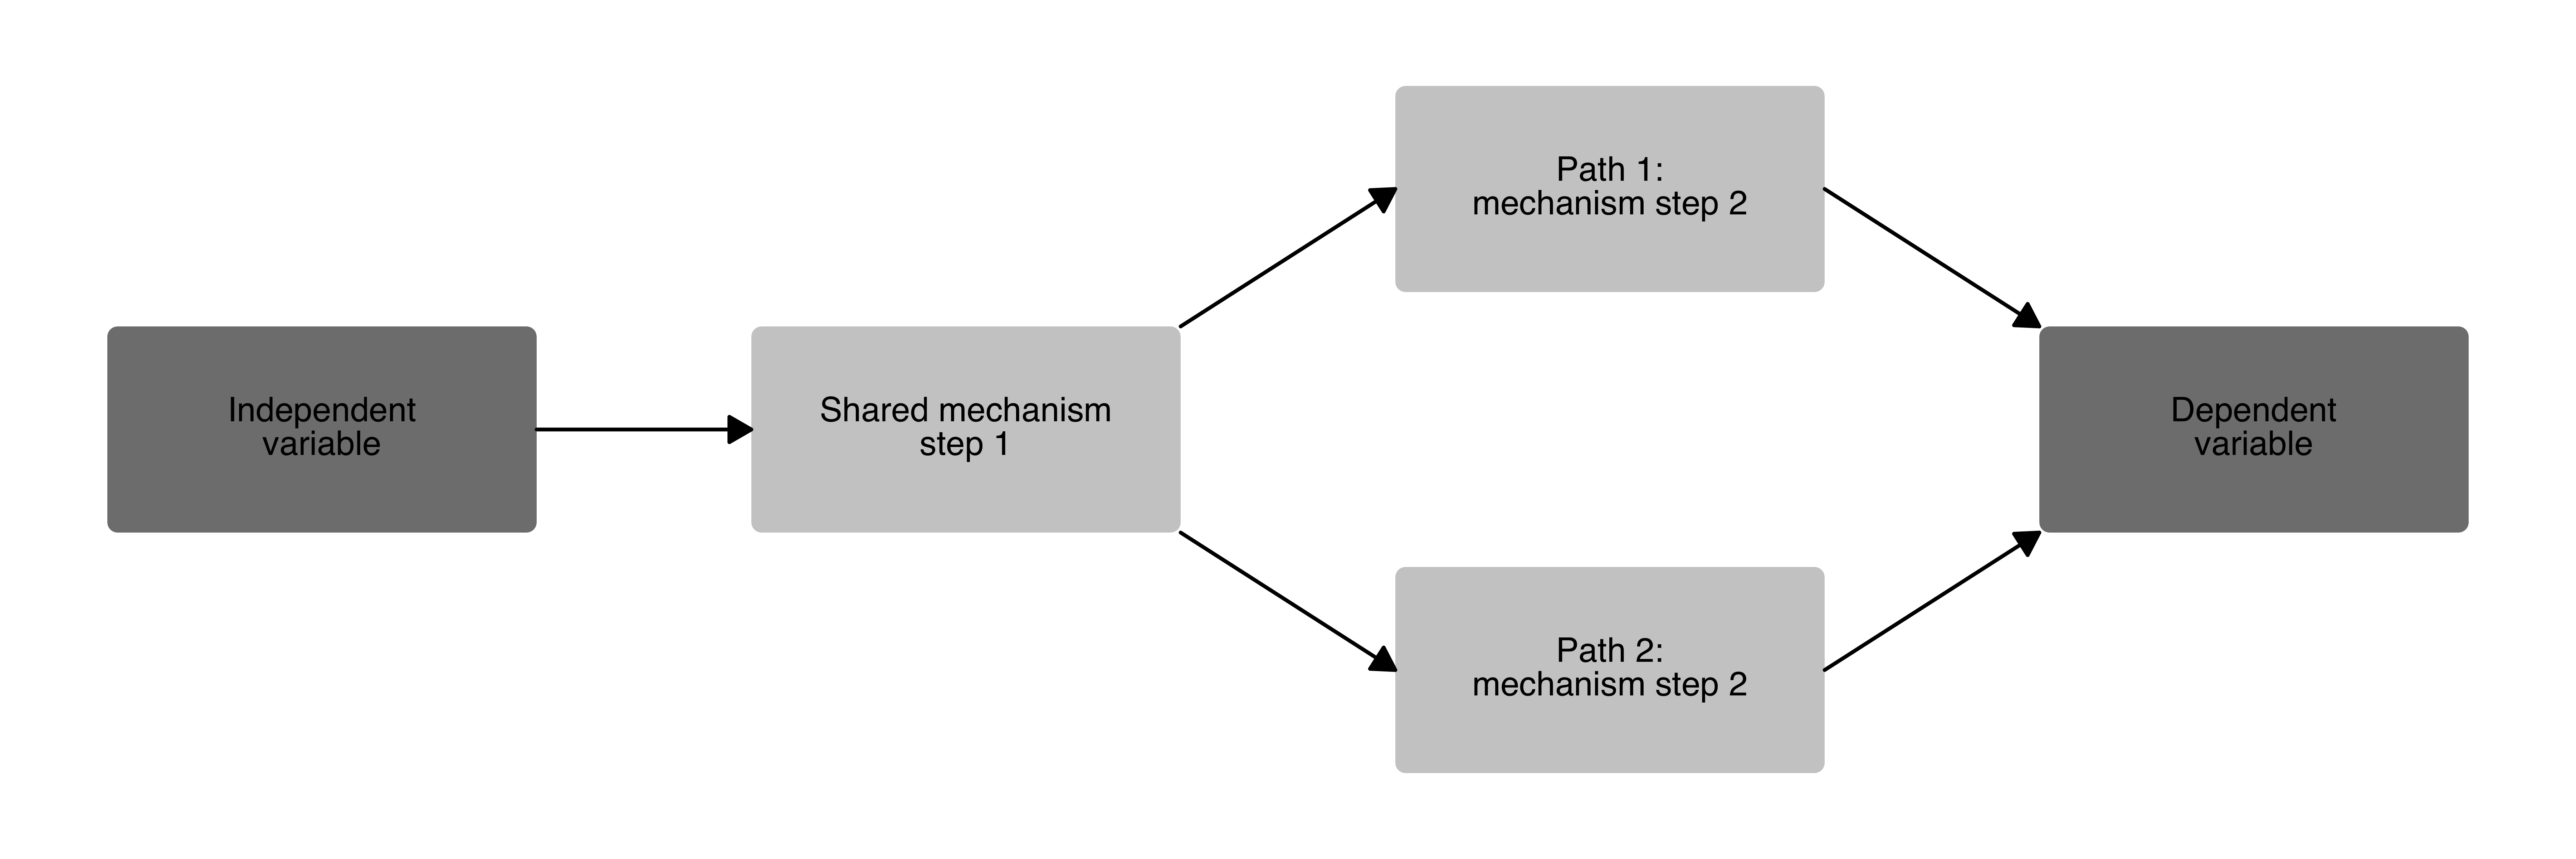
causal_plot(
  type = "1121",
  labels = c(
    "Independent variable",
    "Shared mechanism step 1",
    "Path 1: mechanism step 2",
    "Path 2: mechanism step 2",
    "Dependent variable"
  ),
  wrap_width = 17,
  text_size = 4,
  fill_variables = "grey50", # Set the color for the variable boxes
  fill_mechanisms = "grey80" # Set the color for the process boxes
)
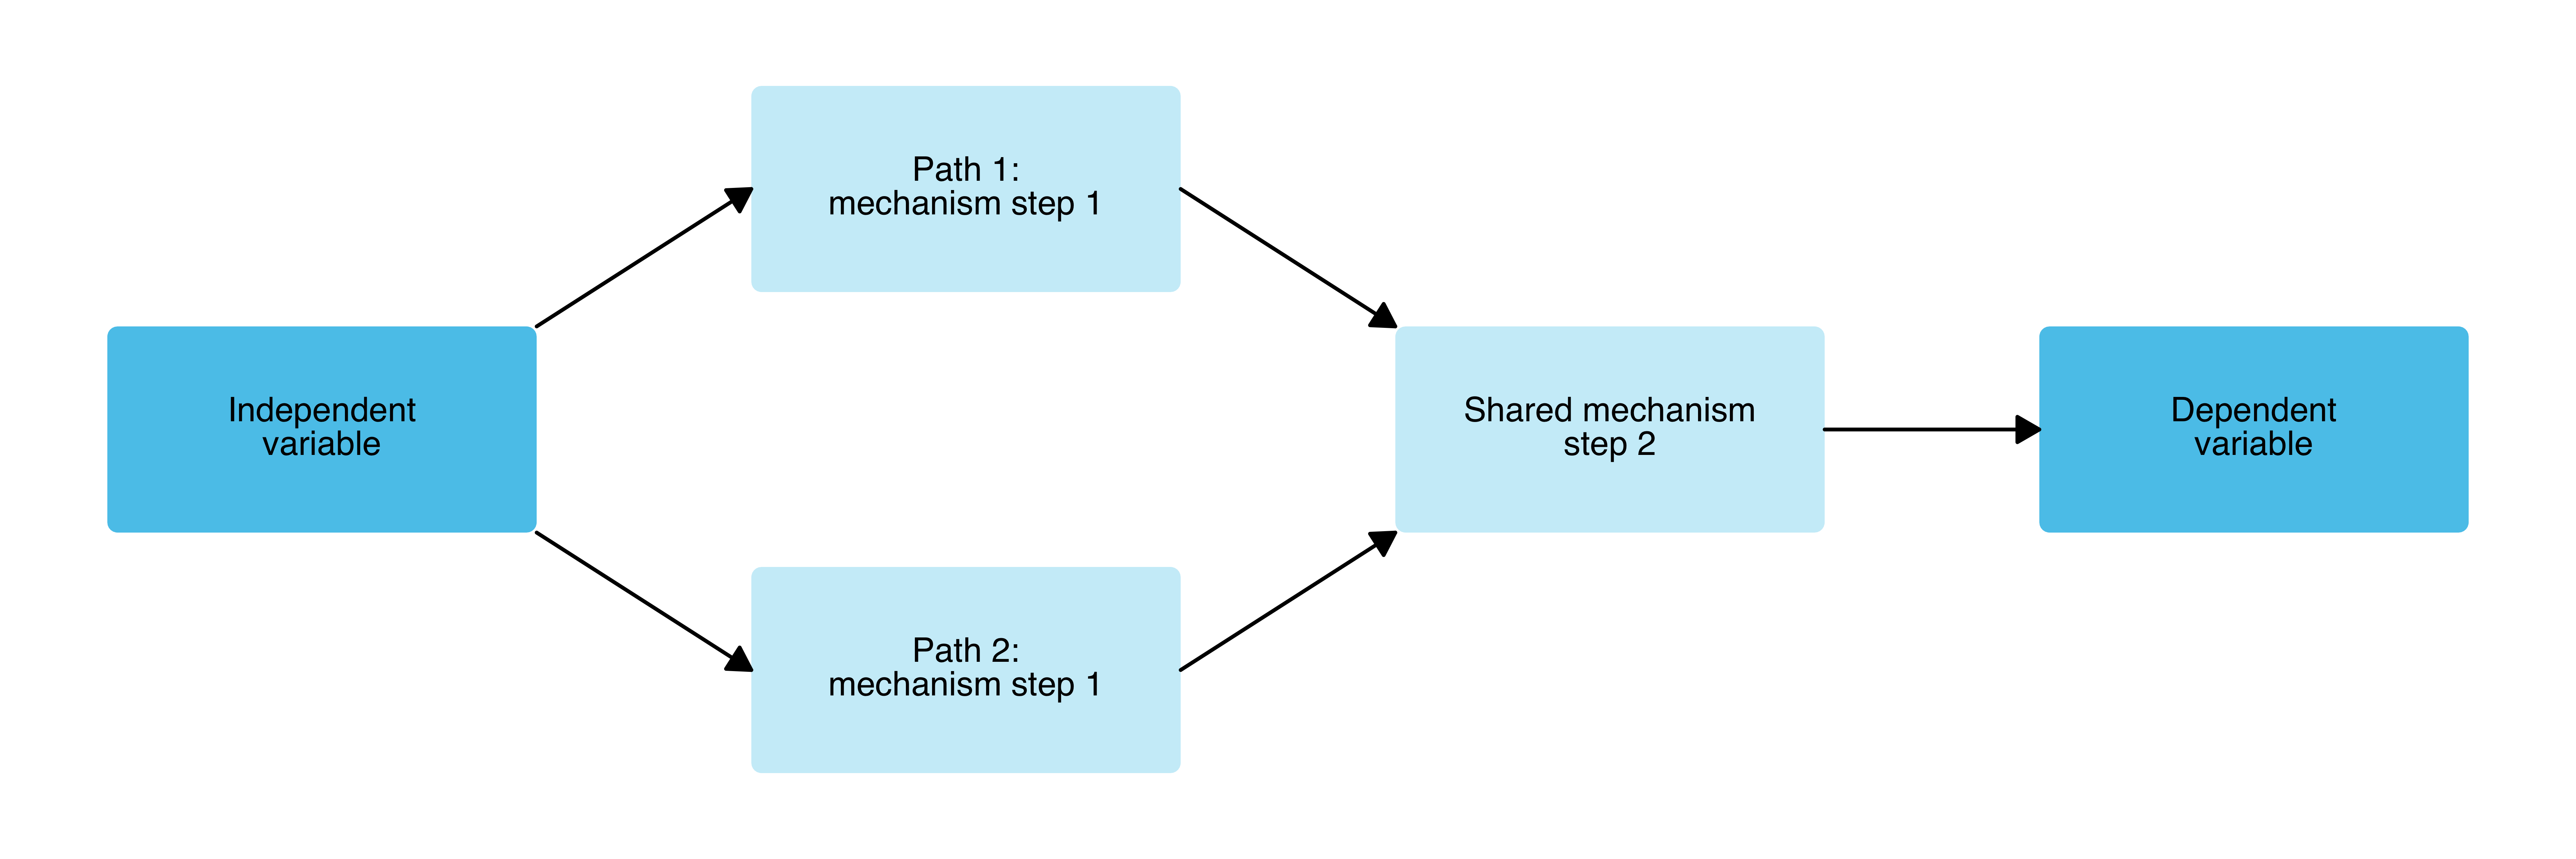
causal_plot(
  type = "1211",
  labels = c(
    "Independent variable",
    "Path 1: mechanism step 1",
    "Path 2: mechanism step 1",
    "Shared mechanism step 2",
    "Dependent variable"
  ),
  wrap_width = 17,
  text_size = 4,
  fill_variables = "#59C7EB",
  fill_mechanisms = "#CCEEF9"
)
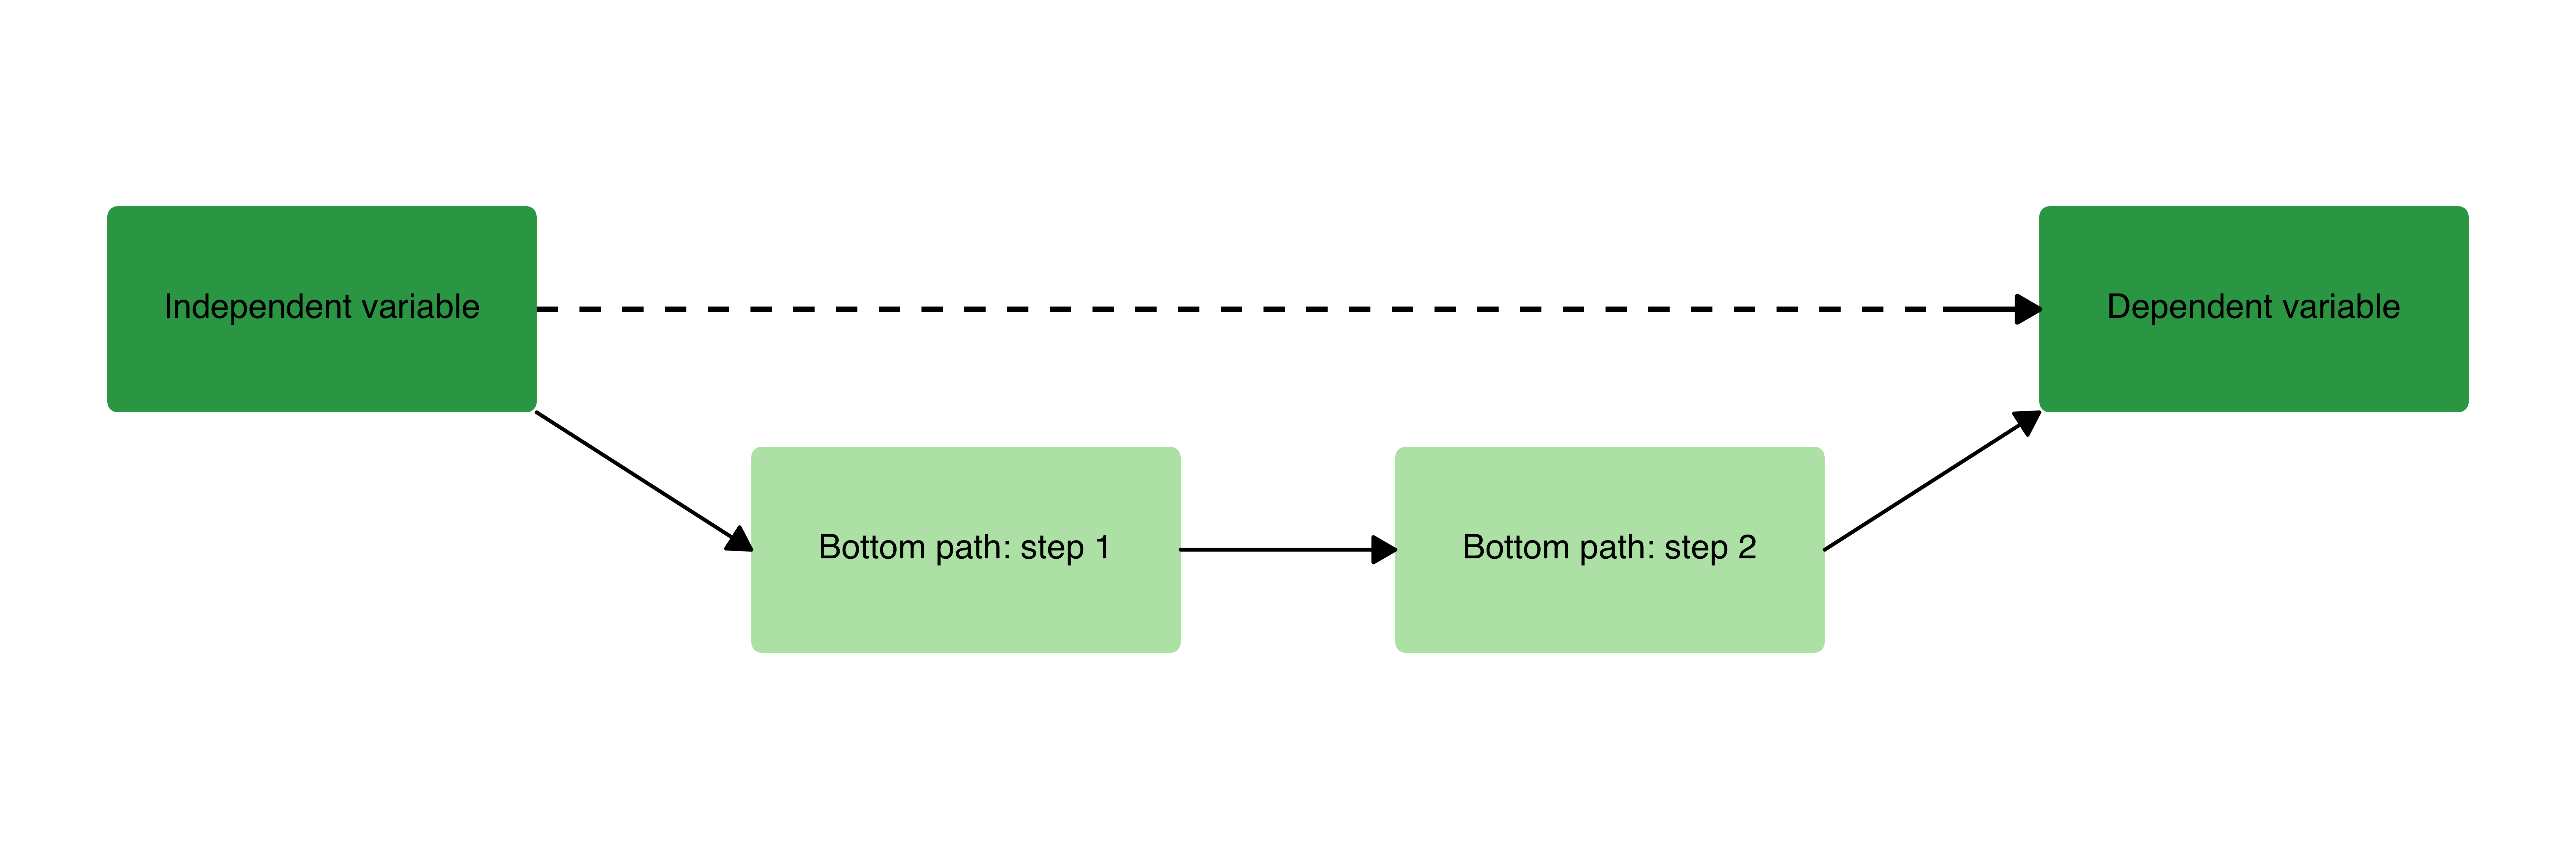
The classic “bathtub” visualization of a causal relationship as discussed in Hedström and Ylikoski (2010), with a direct macro-level arrow and a two-step causal mechanism.
causal_plot(
  type = "bathtub",
  text_size = 4,
  fill_variables = "#31A354",
  fill_mechanisms = "#BAE4B3"
)
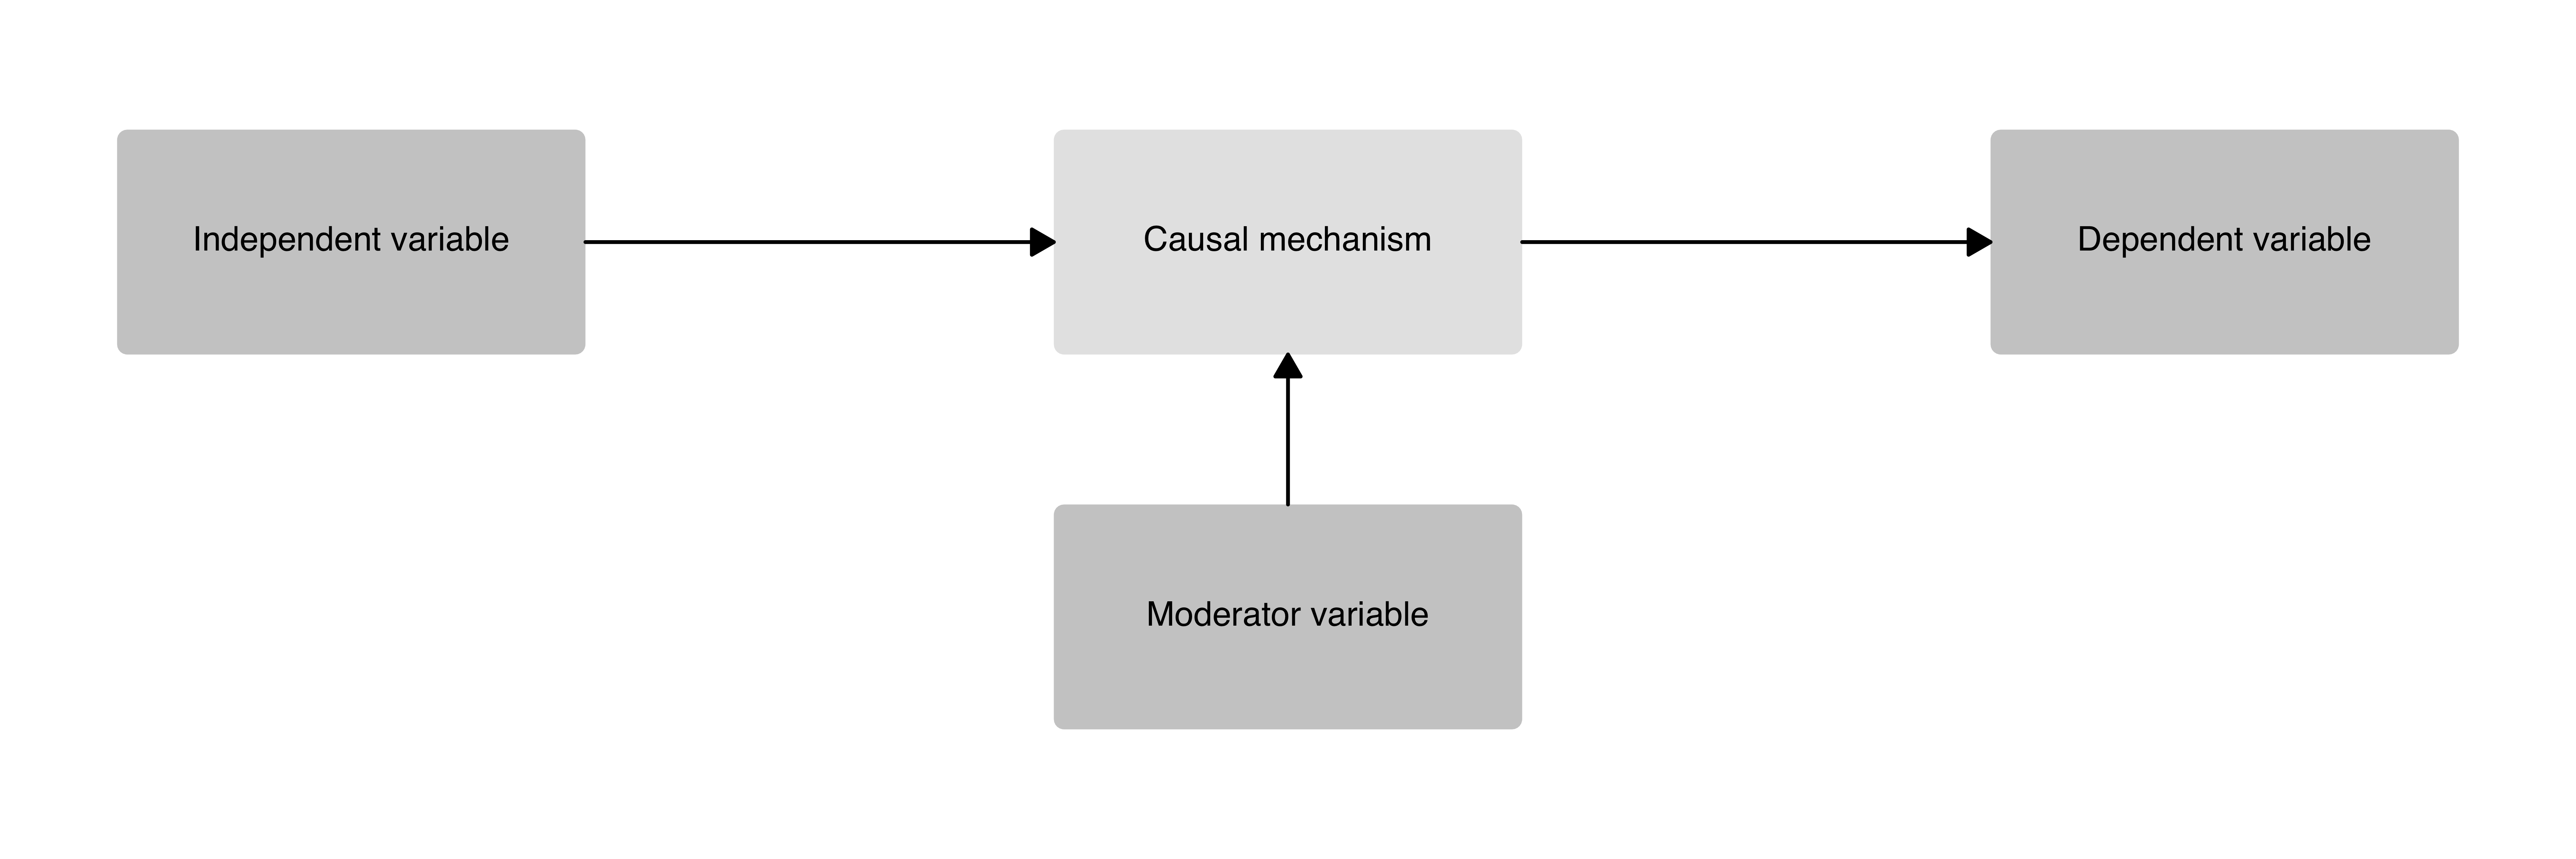
A one-step causal mechanism plot with an independent variable, dependent variable, one causal mechanism box, and a moderator variable.
causal_plot(
  type = "111_moderator",
  labels = c(
    "Independent variable",
    "Causal mechanism",
    "Dependent variable",
    "Moderator variable"
  ),
  text_size = 4
)
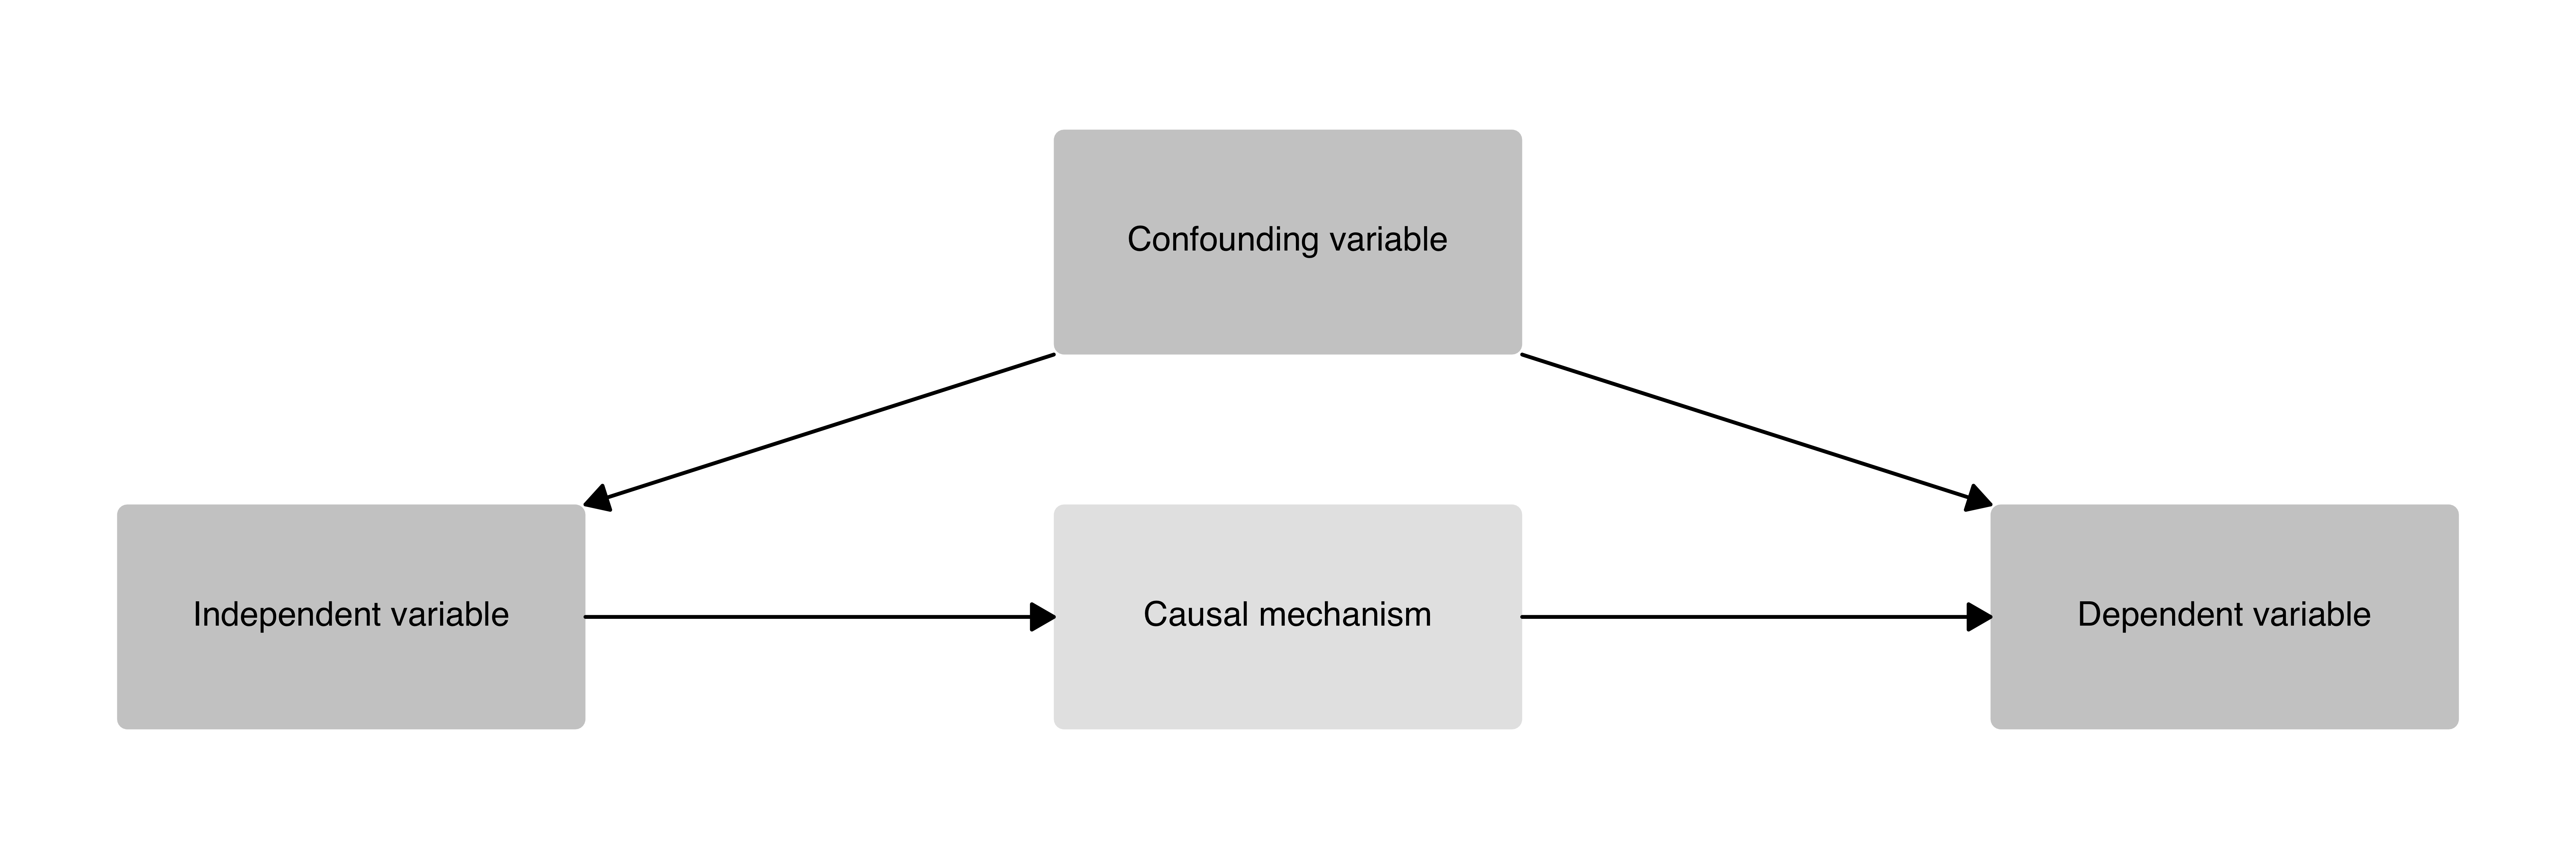
A one-step causal mechanism plot with an independent variable, dependent variable, one causal mechanism box, and a confounding variable.
causal_plot(
  type = "111_confounder",
  labels = c(
    "Independent variable",
    "Causal mechanism",
    "Dependent variable",
    "Confounding variable"
  ),
  text_size = 4
)
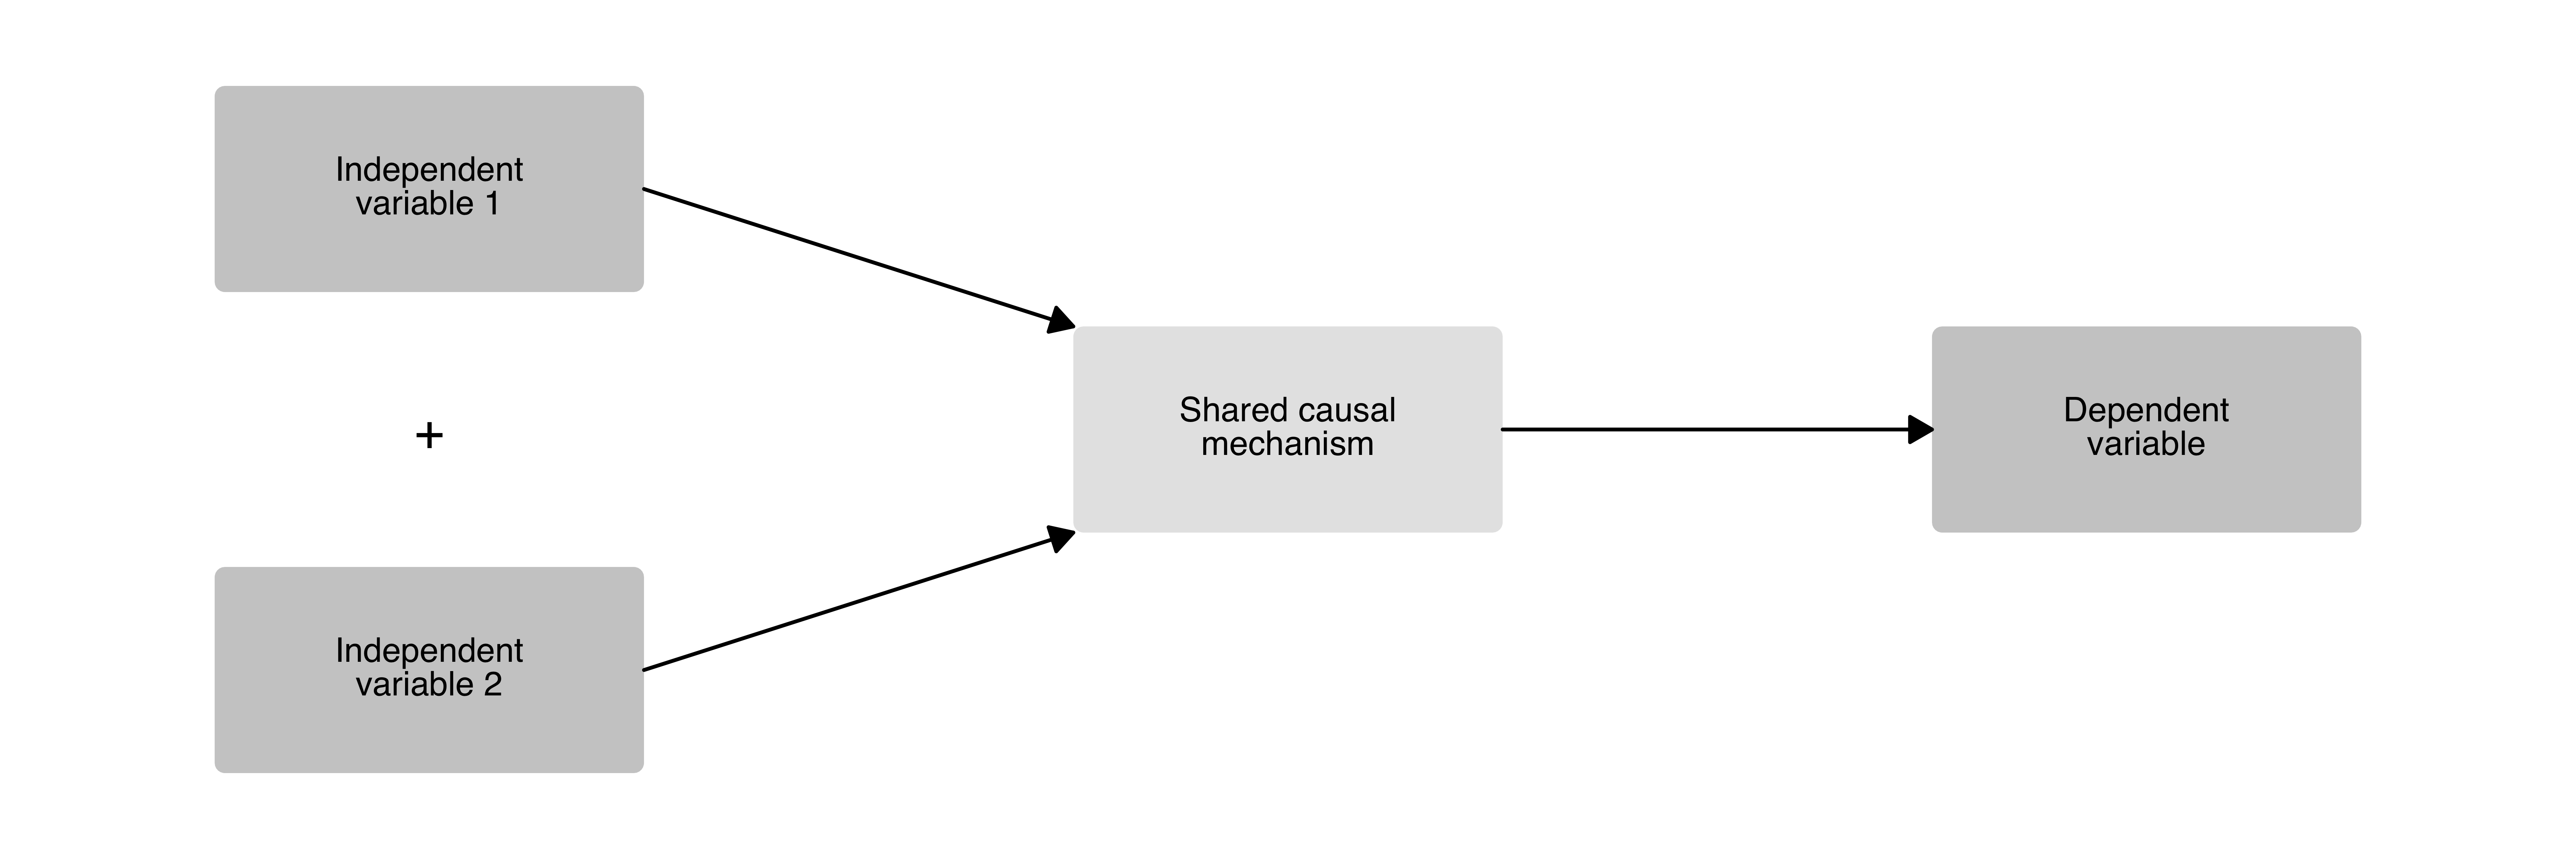
A causal diagram with two independent variables that converge on a shared causal mechanism before producing a single outcome. A “+” sign indicates that both IVs are necessary.
causal_plot(
  type = "211",
  labels = c(
    "Independent variable 1",
    "Independent variable 2",
    "Shared causal mechanism",
    "Dependent variable"
  ),
  text_size = 4,
  wrap_width = 17
)
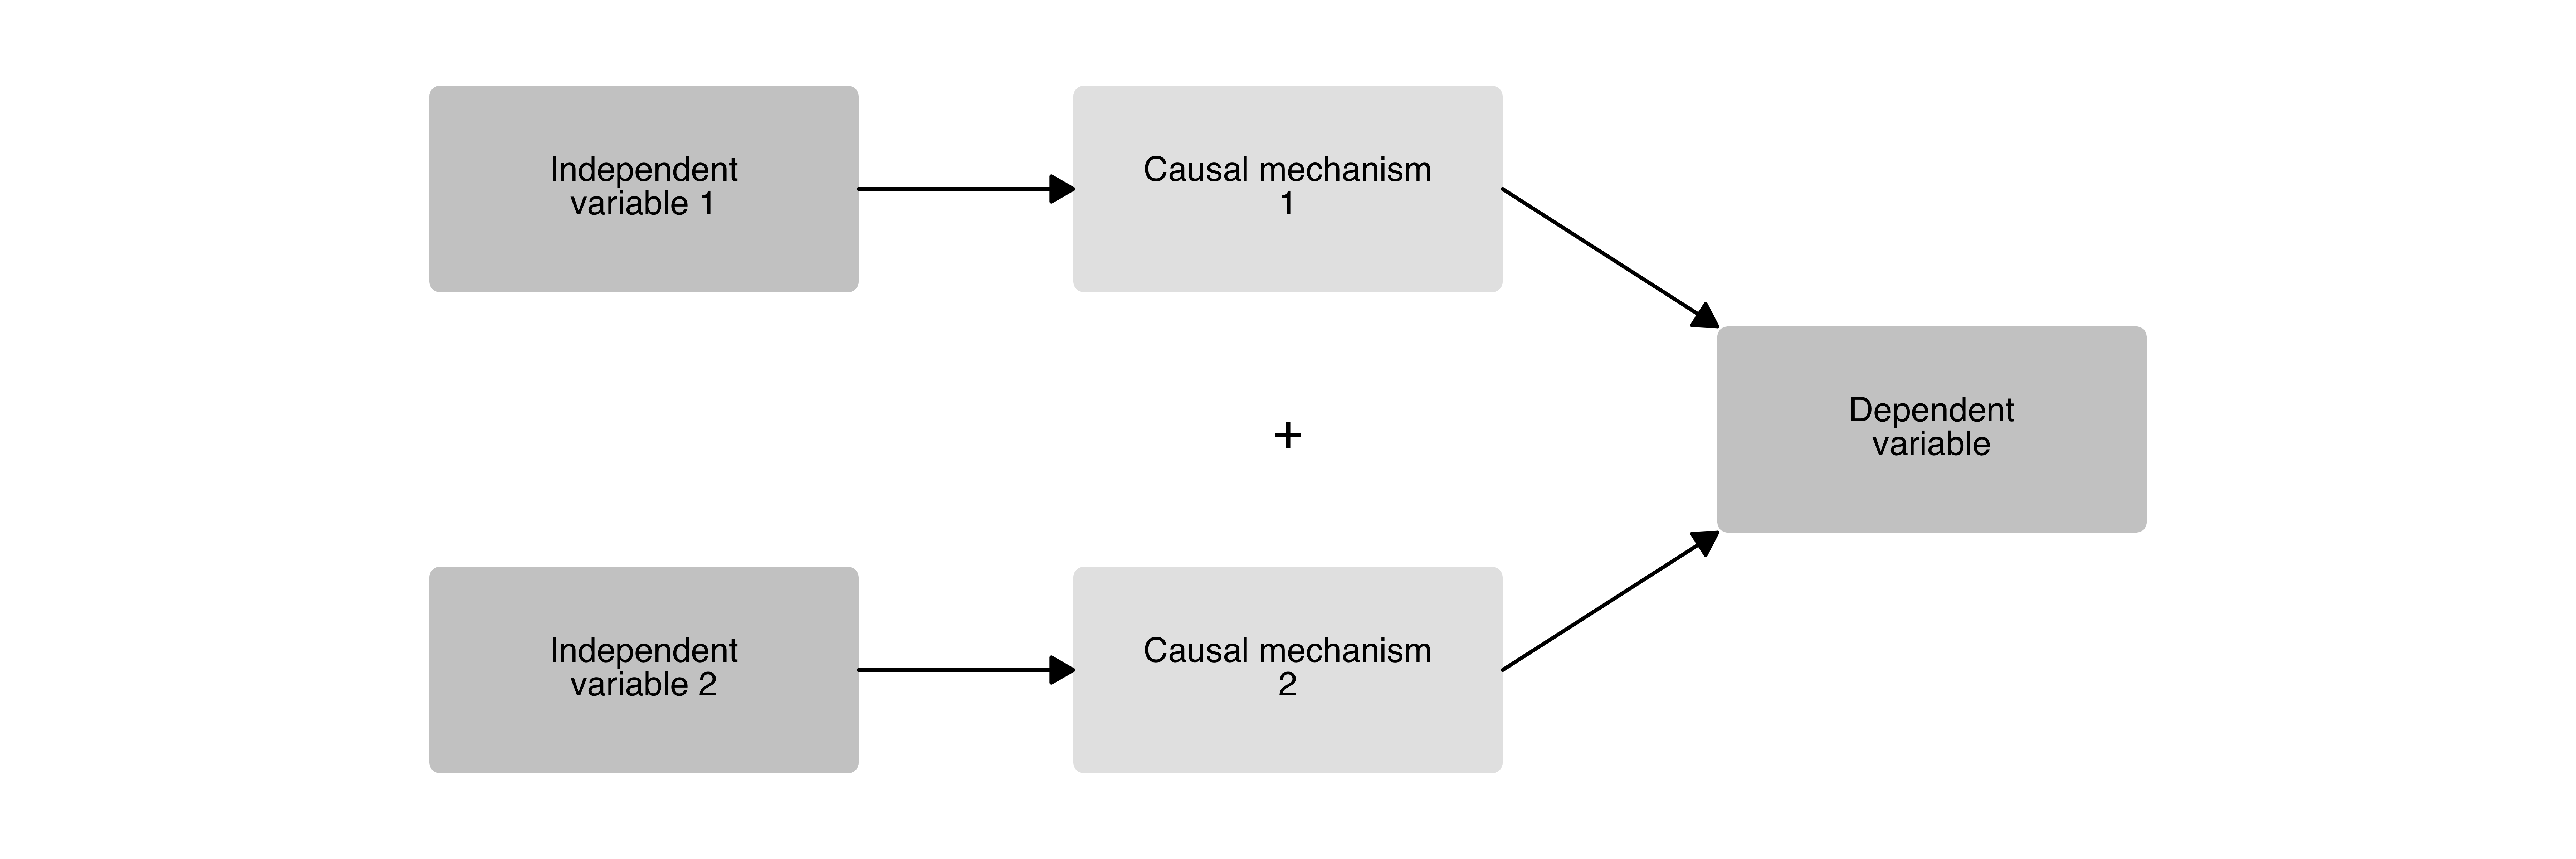
A causal diagram with two independent variables, each operating through its own mechanism, converging on a single outcome. A “+” sign indicates that both mechanisms are necessary.
causal_plot(
  type = "221",
  labels = c(
    "Independent variable 1",
    "Independent variable 2",
    "Causal mechanism 1",
    "Causal mechanism 2",
    "Dependent variable"
  ),
  text_size = 4,
  wrap_width = 17
)
A causal diagram with two independent variables, each going through two sequential mechanism steps, before converging on a single outcome.
causal_plot(
  type = "2221",
  labels = c(
    "Independent variable 1",
    "Independent variable 2",
    "Path 1: mechanism step 1",
    "Path 2: mechanism step 1",
    "Path 1: mechanism step 2",
    "Path 2: mechanism step 2",
    "Dependent variable"
  ),
  text_size = 4,
  wrap_width = 17
)
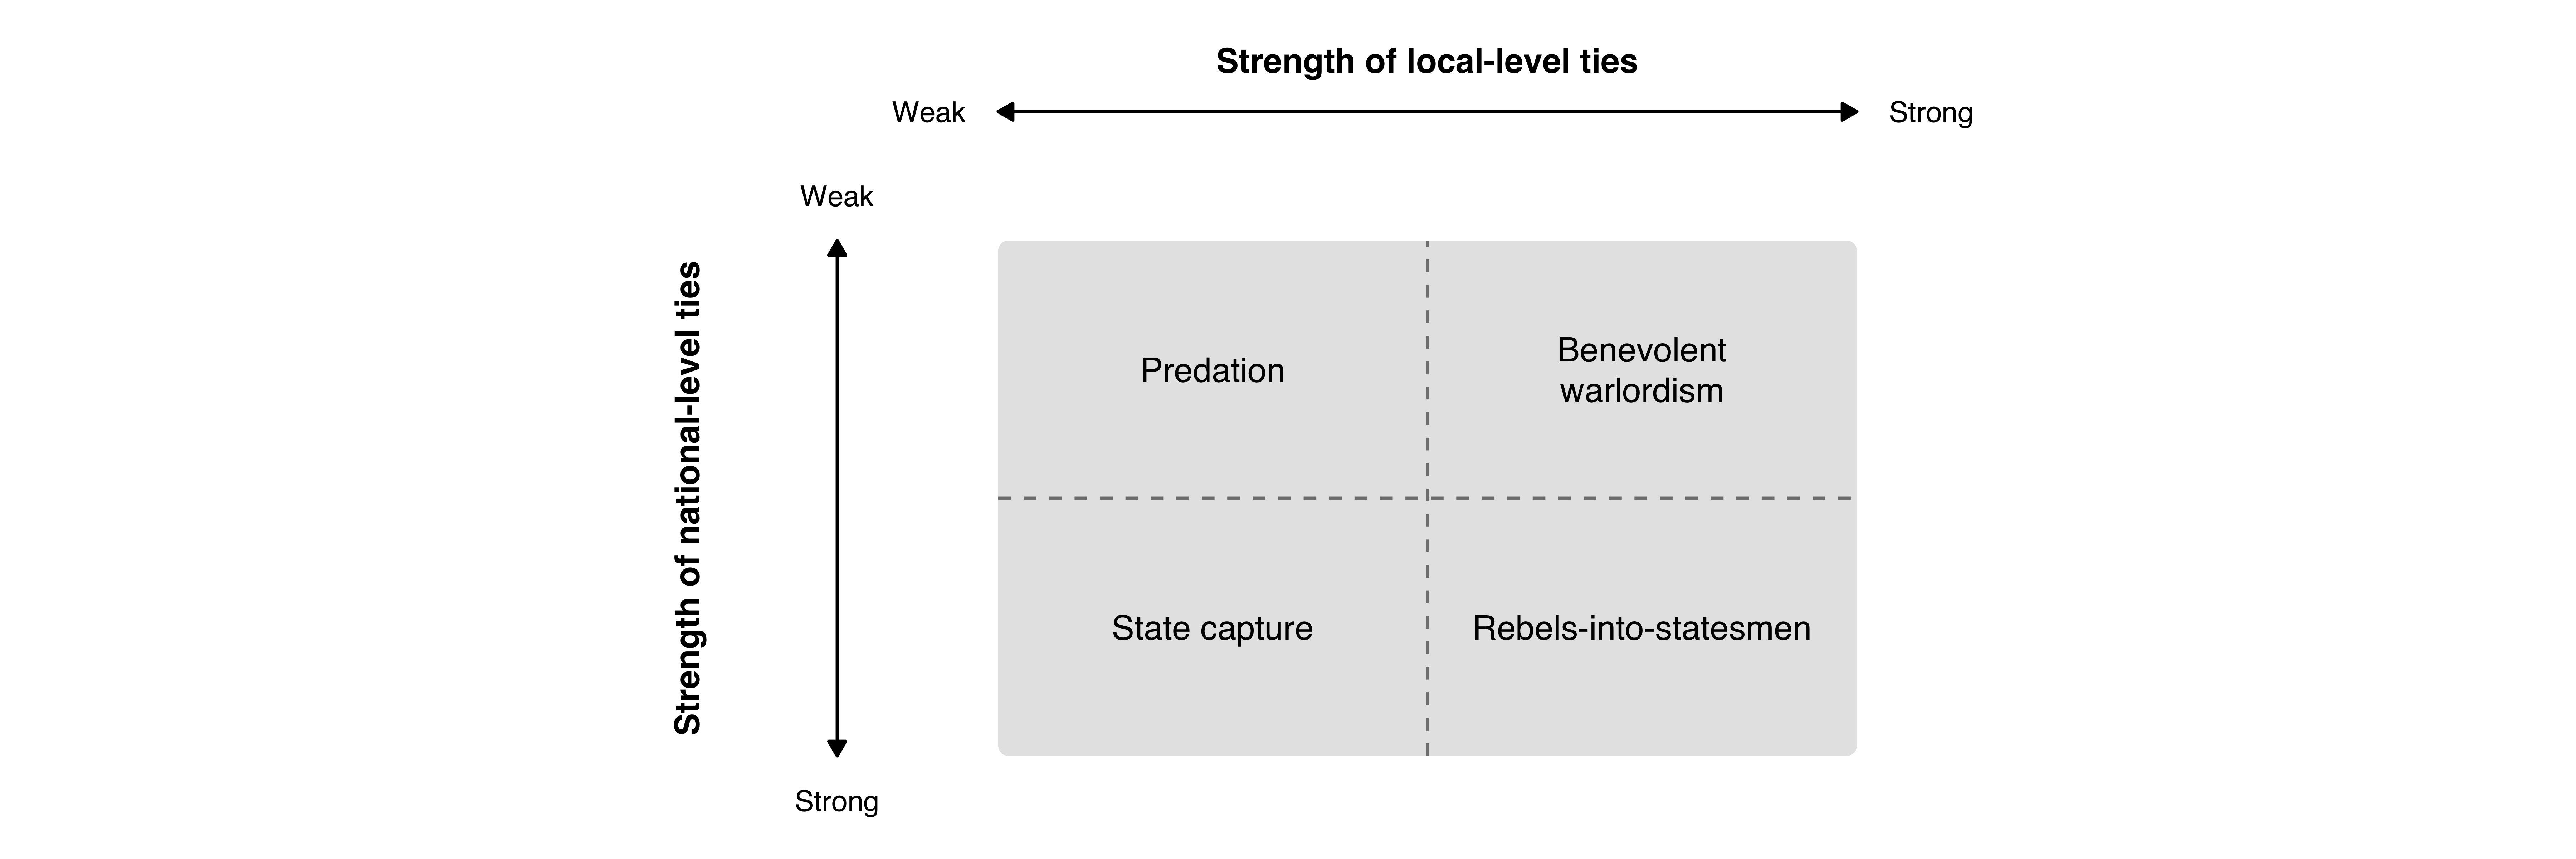
In addition to causal diagrams, causalplot also includes
a typology() function for creating 2x2 descriptive or
explanatory typologies. The function produces a single box divided into
four quadrants by dashed lines, with double-headed axis arrows, axis
labels, endpoint values, and type labels. The example below replicates
the typology in Martin et al. (2021).
typology(
  type_labels = c(
    "Predation",
    "Benevolent warlordism",
    "State capture",
    "Rebels-into-statesmen"
  ),
  x_axis_label = "Strength of local-level ties",
  y_axis_label = "Strength of national-level ties",
  x_axis_values = c("Weak", "Strong"),
  y_axis_values = c("Weak", "Strong"),
  text_size = 4,
  axis_text_size = 4
)
causalplot uses ggplot2 to generate the
plots, so they can be saved using the ggsave command.
ggplot2::ggsave("man/figures/causal_plot.png", height = 5, width = 12)Did you like the package? No need to cite it, but please add a footnote somewhere with the following text:
“Generated using the causalplot R package created by Sebastian van Baalen.”