An interactive, ultra-responsive, and high-fidelity data explorer widget for clinical programming (CDISC SDTM/ADaM) and general R data frames, built on a virtualized React grid backend.


dtsmartr is a premium, Kaggle-style data browser package for R. Leveraging a virtualized React rendering engine and a custom Base64 Apache Arrow IPC serialization pipeline, it delivers instantaneous rendering and fluid scrolling on tables containing millions of cells—directly inside the RStudio/Positron Viewer pane, embedded in Shiny, or exported as offline-capable HTML reports.
For step-by-step installation guides, API reference sheets, and feature articles, visit our official documentation site: 👉 https://wagh-nikhil.github.io/dtsmartr/
Depending on the scale of your dataset and analytical needs,
dtsmartr offers two tailored frontend engines:
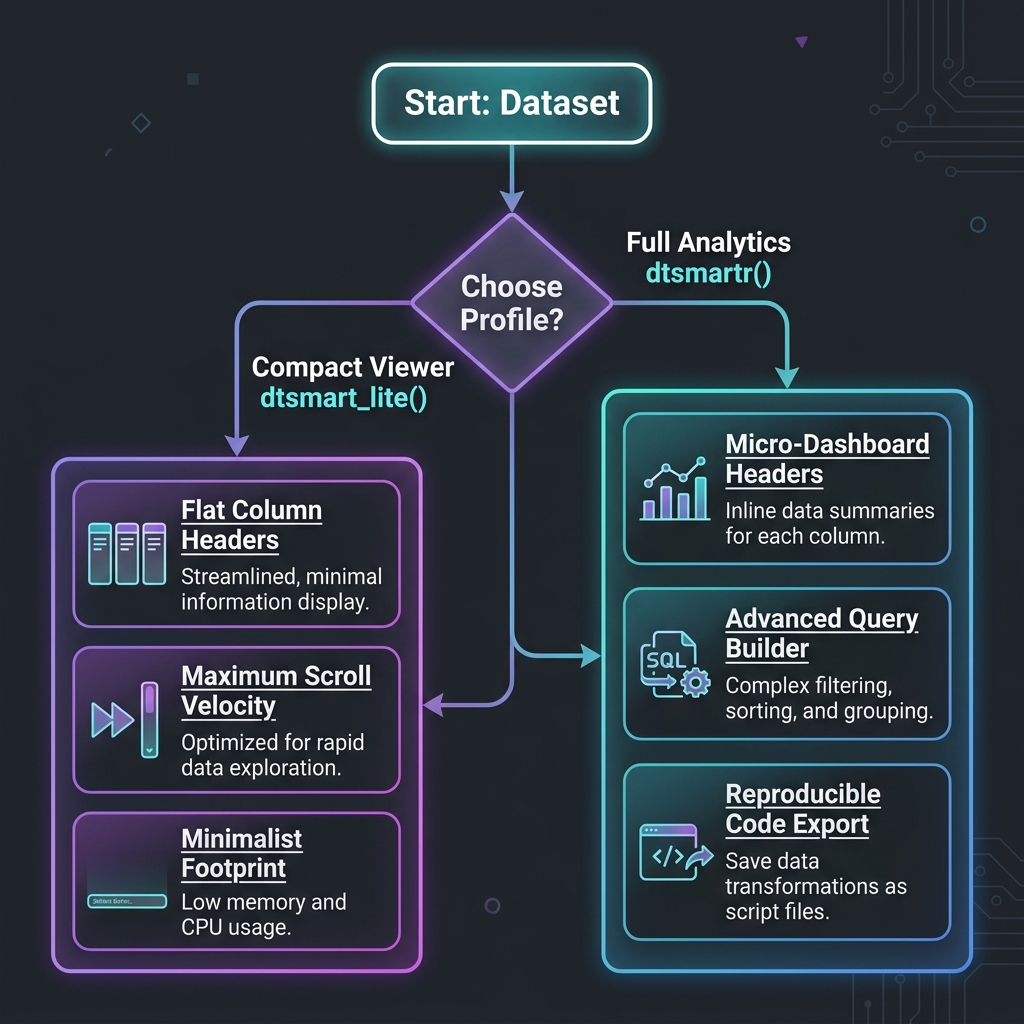
dtsmartr()
— Full Analytics Mode (Default)Enables the complete suite of analytical features, designed for deep
exploration: * Micro-Dashboard Headers: Live
histograms, stacked categorical bars, and data completeness progress
bars. * Insights Drawer: Interactive SVG distribution
histograms and Pareto charts. * Query Builder:
Multi-rule, nested Boolean logic filters (AND/OR). * Code
Export: Code generation for Base R, dplyr, SQL,
and Apache Arrow.
dtsmart_lite() — Minimalist Viewer ModeForces a compact, ultra-clean grid layout optimized for raw scrolling performance and minimal memory footprint: * Flat Headers: Hides distributions, progress bars, and stats from column headers to maximize visible grid space. * Analytics Disabled: Hides the Advanced Query Builder, Insights Drawer, and Code Export controls. * High Refresh Rate: Streamlines the DOM footprint to ensure maximum scrolling velocity on huge data structures.
≡ Min / ≡ Auto /
≡ Detail) and row padding (Compact /
Standard / Comfort) directly in the toolbar.
Row height scales dynamically (24px → 32px → 40px), doubling screen
layout capacity. Density modes can also be configured programmatically
from R.🔒 Constant, ⚖️ CV) or binary
stacked bars instead of full histograms to maximize screen estate.1️⃣ ↑, 2️⃣ ↓) and a toolbar sort chain
display.?
to open the overlay cheatsheet modal. Shortcuts include
Ctrl+Alt+F for filter, Ctrl+Shift+[ /
] for density, and Ctrl+Shift+F to clear.3px solid #3b82f6) along the frozen boundary
across the header and all body cells.⇅) from quick-filter popovers (≡) on header
cards to prevent accidental clicks.# for numeric,
a for character, L for logical,
📅 for date-time).label attributes (highly common in
CDISC SDTM/ADaM datasets) and renders them as clear sub-headers.df[df$AGE > 50 & df$SEX == "F", ]df %>% filter(AGE > 50, SEX == "F")SELECT * FROM df WHERE AGE > 50 AND SEX = 'F'df |> filter(AGE > 50) |> collect()dtsmart_launch() Data Ingestion
Wizard: Start a local uploader wizard to drag-and-drop local
Excel, CSV, RDS, or SAS (.sas7bdat) files directly into the
grid.Our serialization protocol is engineered for speed. In version
0.3.0, dtsmartr transitioned to a high-speed
Apache Arrow IPC Binary Stream Serialization
pipeline:
[R Data Frame]
    │
    ▼  (Apache Arrow C++ Engine)
[Arrow RecordBatch Stream]
    │
    ▼  (base64enc C-Library)
[Base64 Arrow IPC Payload] ---> Written directly into the HTMLWidget structure
                                    │
                                    ▼ (React App on Page Load)
                                [Uint8Array Decode]
                                    │
                                    ▼ (apache-arrow JS Library)
                                [Arrow Columnar Table]
                                    │
                                    ▼
[Virtualized Grid View]Install the package directly from GitHub using
remotes:
# Install remotes if needed
if (!requireNamespace("remotes", quietly = TRUE)) {
  install.packages("remotes")
}

# Install the latest dev version
remotes::install_github("wagh-nikhil/dtsmartr")Fire up the grid on standard datasets in one line:
library(dtsmartr)

# 1. Full Analytics Mode (Default)
dtsmartr(mtcars)

# 2. Minimalist Viewer Mode (Clean, compact layout)
dtsmart_lite(iris, title = "Iris Compact View")

# 3. Custom configurations (Dark theme, pre-hidden variables)
dtsmartr(
  data = mtcars,
  options = dtsmartr_options(
    theme = "dark",
    hidden_columns = c("cyl", "hp"),
    na_string = "Missing"
  )
)Licensed under the MIT License.