


Version 1.2.0; documentation built 2026-11-04
The ggCheysson package brings the graphical styles of
the Albums de Statistique Graphique to R and ggplot2.
The Albums were produced by the Ministry of Public Works in France under the direction of Émile Cheysson from 1879-1897. They represent the “pinnacle of the Golden Age of Statistical Graphics” (Friendly, 2008) for their innovation in visualization techniques, graphic design and beauty.
The package is based on work by:
The Albums de Statistique Graphique were published annually by France’s Ministry of Public Works, showcasing infrastructure statistics through innovative visualizations. Under Émile Cheysson’s direction, these albums combined:
This package preserves these design elements for modern statistical graphics. Perhaps more interesting is the historical motivation that led to this project by me and the others mentioned above. Émile Cheysson and his draftspeople at the Ministry of Public Works drew all these plates by hand.
Install the development version from GitHub or R-universe:
# install.packages("remotes")
remotes::install_github("friendly/ggCheysson")

# or, from R-universe
install.packages("ggCheysson", repos = c("https://friendly.r-universe.dev"))For full functionality, install these packages:
install.packages(c("ggpattern", "systemfonts"))This package provides a complete aesthetic system for creating visualizations in Cheysson’s distinctive style:
1880_07,
1881_12)theme_cheysson() - Full period-appropriate themetheme_cheysson_minimal() - Minimal grid varianttheme_cheysson_map() - Optimized for cartographic
workThese were derived by RJ Andrews from a collection of 25 thematic maps across the span of years in which the Albums were produced, shown below.
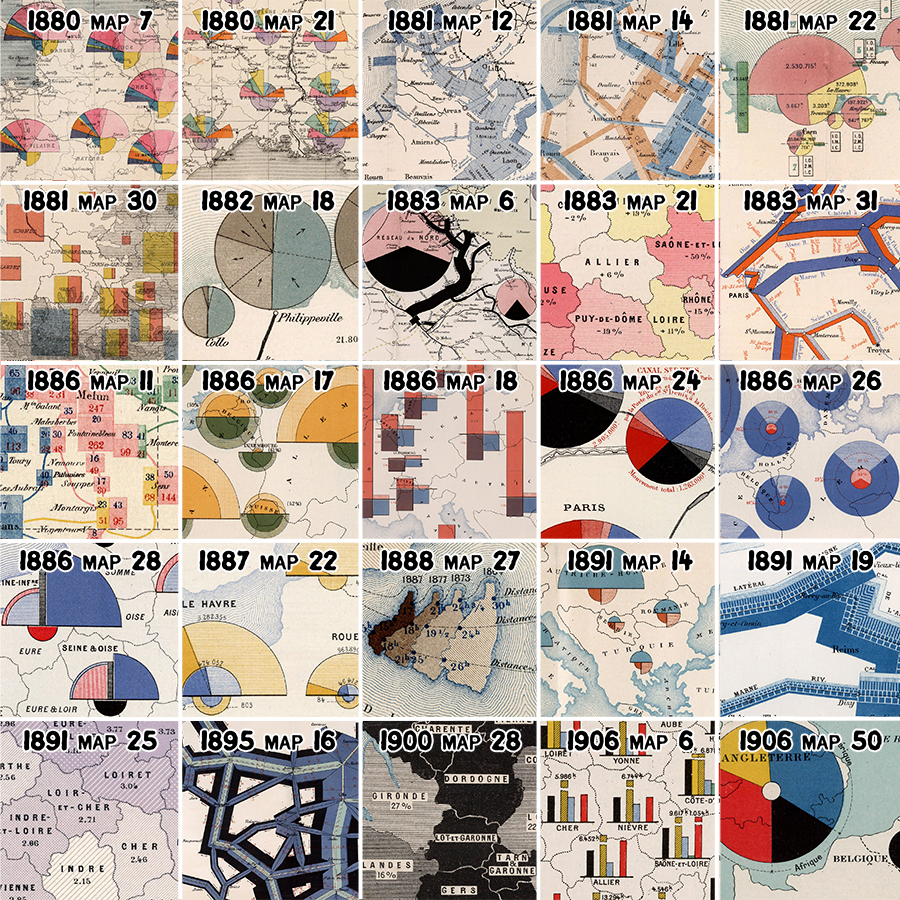
From these, he abstracted the following combinations of color and pattern he thought characterized these maps:

In the development version (1.2.0), scale_cheysson()
(experimental) applies Cheysson’s actual designed color-pattern
pairings in a single call. Each element of a palette is a
swatch, a ggpattern pattern that draws its fill
color, hatch type, line colors, angle and line spacing together, so a
plot needs only aes(pattern = x) and one scale (see the
examples below, and vignette("combining-colors-patterns")).
The individual pattern scales,
scale_pattern_type_cheysson() and the rest, remain for
control over each property.
Here are a few examples to get you started.
Use the color palette of the 1881 Album, plate 4
library(ggplot2)
library(ggCheysson)

ggplot(iris, aes(Sepal.Length, Sepal.Width, color = Species)) +
  geom_point(size = 3) +
  scale_color_cheysson("1881_22") +
  labs(title = "Iris Dataset") +
  theme_minimal()
# Load Cheysson fonts (once per session)
load_cheysson_fonts(method = "showtext")
# Enable showtext for rendering
showtext::showtext_auto()

p1 <- ggplot(mtcars, aes(wt, mpg, color = factor(cyl))) +
  geom_point(size = 3) +
  scale_color_cheysson("1883_31") +
  labs(
    title = "Automobile Efficiency",
    subtitle = "Weight vs Fuel Economy",
    x = "Weight (1000 lbs)",
    y = "Miles per Gallon"
  )

p1 + theme_cheysson()
base_sizeLike other ggplot2 themes, theme_cheysson() takes a
base_size for larger output (slides, posters). Title and
axis-title text (set in the decorative
CheyssonTitle/CheyssonSansCaps fonts) is
corrected to scale at the same rate as the rest of the theme, rather
than reading undersized as base_size grows:
p1 + theme_cheysson(base_size = 14)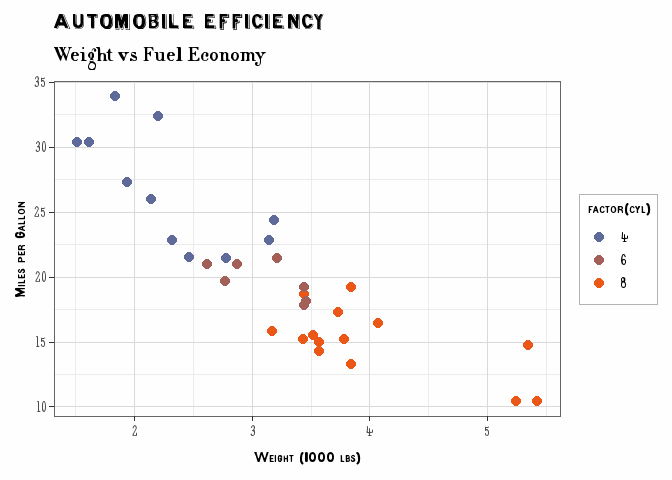
p1 + theme_cheysson(base_size = 16)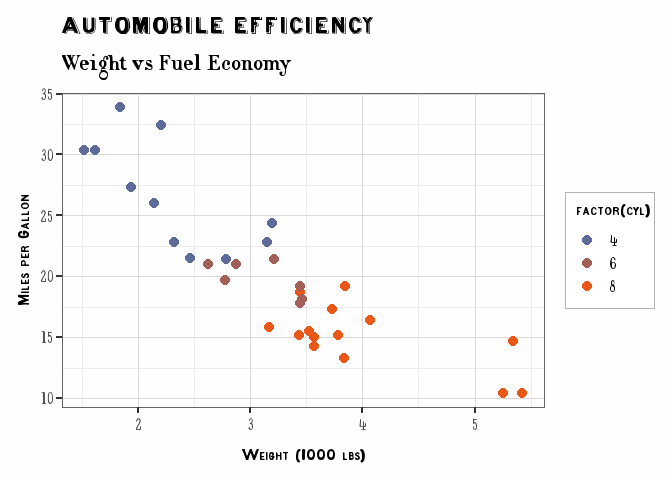
library(ggpattern)

data <- data.frame(
  category = LETTERS[1:4],
  value = c(15, 23, 18, 20)
)

# One scale applies the palette's colors, hatch types, angles and spacings together
ggplot(data, aes(category, value, pattern = category)) +
  geom_col_pattern(color = "black") +
  scale_cheysson("1883_30") +
  labs(
    title = "Statistical Comparison",
    x = "Category",
    y = "Value"
  ) +
  theme_cheysson() +
  theme(legend.position = "none")
cheysson_palettes provides 25 named color palettes, each
with its type (sequential, diverging, grouped, or category), the album
year and plate number it was extracted from, and its hex color
codes.
library(ggCheysson)

# List all palettes
list_cheysson_pals()
#>       name       type album plate n_colors
#> 1  1880_07    grouped  1880     7        5
#> 2  1880_21   category  1880    21        7
#> 3  1881_12 sequential  1881    12        1
#> 4  1881_14    grouped  1881    14        2
#> 5  1881_22   category  1881    22        4
#> 6  1881_30    grouped  1881    30        5
#> 7  1882_18    grouped  1882    18        2
#> 8  1883_21  diverging  1883    21        3
#> 9  1883_30   category  1883    30        4
#> 10 1883_31  diverging  1883    31        2
#> 11 1886_11    grouped  1886    11        4
#> 12 1886_17    grouped  1886    17        3
#> 13 1886_18    grouped  1886    18        3
#> 14 1886_24    grouped  1886    24        3
#> 15 1886_26 sequential  1886    26        2
#> 16 1886_28   category  1886    28        3
#> 17 1887_22    grouped  1887    22        2
#> 18 1888_27 sequential  1888    27        1
#> 19 1891_14    grouped  1891    14        2
#> 20 1891_19 sequential  1891    19        1
#> 21 1891_25 sequential  1891    25        2
#> 22 1895_16 sequential  1895    16        3
#> 23 1900_28 sequential  1900    28        2
#> 24 1906_06   category  1906     6        6
#> 25 1906_50   category  1906    50        4

# List by type
list_cheysson_pals("sequential")
#>      name       type album plate n_colors
#> 1 1881_12 sequential  1881    12        1
#> 2 1886_26 sequential  1886    26        2
#> 3 1888_27 sequential  1888    27        1
#> 4 1891_19 sequential  1891    19        1
#> 5 1891_25 sequential  1891    25        2
#> 6 1895_16 sequential  1895    16        3
#> 7 1900_28 sequential  1900    28        2
# View palette colors
cheysson_pal("1880_21")
#> [1] "#d9636c" "#869e80" "#dec367" "#85aab1" "#aea9a4" "#ed8238" "#ab90a4"Use show_palette() to display a palette with color
swatches and hex codes:
# Display a single palette with metadata
show_palette("1895_16")
# Display multiple palettes at once
show_palettes(c("1880_21", "1906_06", "1881_30"))
# One palette of each type in a 2x2 grid: category, sequential, diverging, grouped
show_palettes(c("1880_21", "1895_16", "1883_21", "1881_30"), ncol = 2)
Some palettes, such as the sequential 1881_12, have only
one color: Cheysson made the steps with hatching of increasing density
rather than with shades. Their swatches here show a single color; use
cheysson_pattern("1881_12") to get the full palette (see
Pattern Support, below).
# Display all palettes of a specific type
show_palettes("category")
Palette types:
With ggpattern, recreate the distinctive hatching styles - each palette pairs colors with historically accurate patterns (solid fills, stripes, crosshatching):
library(ggpattern)

# List available pattern palettes
head(list_cheysson_patterns())
#>      name       type album plate n_patterns
#> 1 1880_07    grouped  1880     7          7
#> 2 1880_21   category  1880    21          7
#> 3 1881_12 sequential  1881    12          3
#> 4 1881_14    grouped  1881    14          4
#> 5 1881_22   category  1881    22          4
#> 6 1881_30    grouped  1881    30          8

# Each element of a palette is a bundle of properties
patterns <- cheysson_pattern("1886_24")
str(patterns[[2]])
#> List of 7
#>  $ type             : chr "crosshatch"
#>  $ fill             : chr "transparent"
#>  $ pattern_fill     : chr "#b61002"
#>  $ pattern_color    : chr "#b61002"
#>  $ pattern_density  : num 0.974
#>  $ pattern_spacing  : num 0.0263
#>  $ pattern_linewidth: num 2
# Display the palette's elements as swatches
n <- length(patterns)
ggplot(data.frame(i = factor(seq_len(n))), aes(i, 1, pattern = i)) +
geom_col_pattern(color = "black", width = 0.95) +
scale_cheysson("1886_24") +
theme_void() +
theme(legend.position = "none")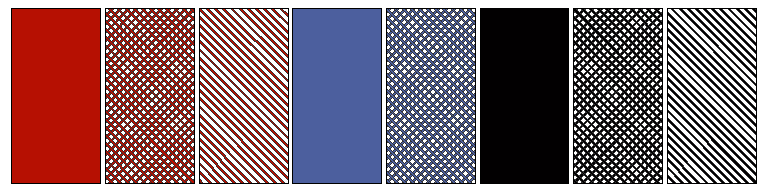
Use scale_cheysson() in a plot to give each category a
swatch:
data <- data.frame(category = LETTERS[1:4], value = c(15, 23, 18, 20))

ggplot(data, aes(category, value, pattern = category)) +
  geom_col_pattern(color = "black") +
  scale_cheysson("1886_24") +
  labs(title = "Statistical Comparison", x = "Category", y = "Value") +
  theme_minimal()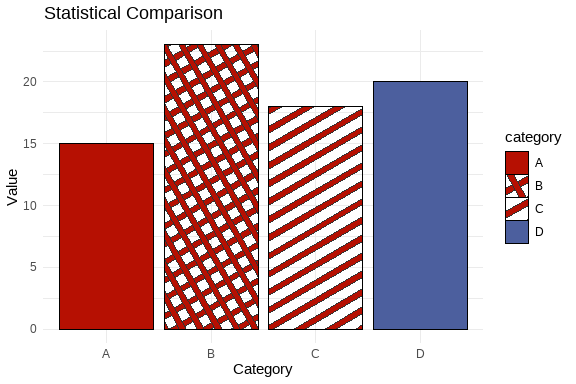
show_swatches() draws every swatch, one row per palette,
grouped by palette type. The swatch in row 1886_24, column
2 is "1886_24-2", and
scale_cheysson("1886_24") uses that row from left to
right:
show_swatches()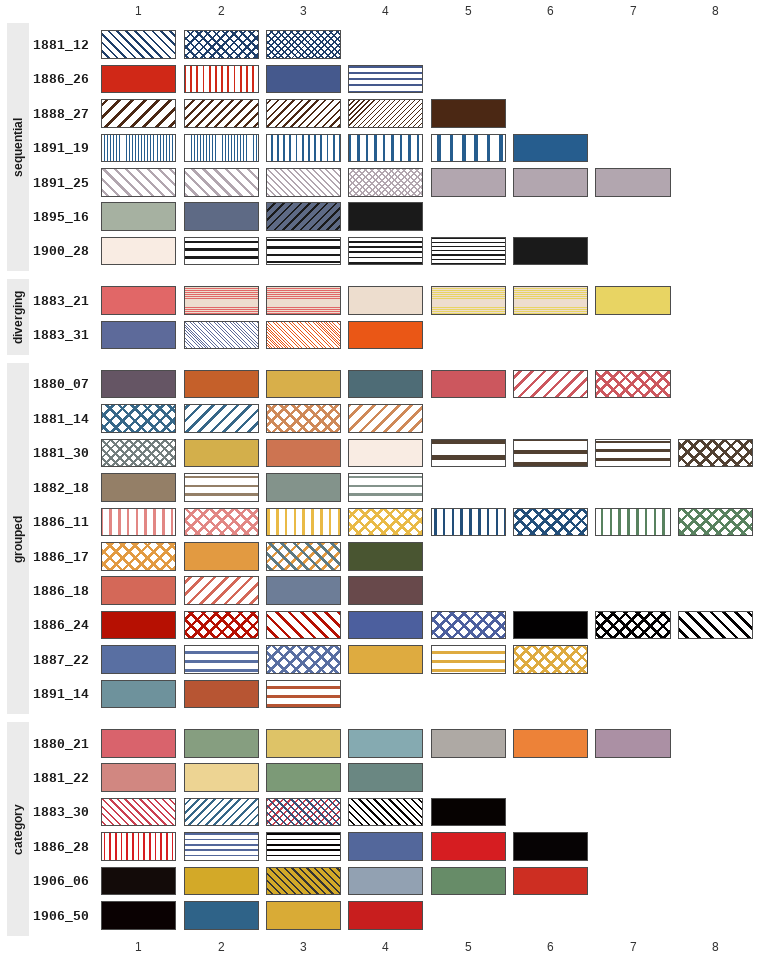
For control over each property separately, use the individual pattern
scales (scale_fill_cheysson_pattern(),
scale_pattern_type_cheysson(),
scale_pattern_fill_cheysson(), …), mapping each aesthetic
yourself.
Five Cheysson font families are included:
| Family | Description | Use |
|---|---|---|
Cheysson |
Regular serif | Body text, labels |
CheyssonItalic |
Italic variant | Emphasis |
CheyssonSansCaps |
Sans capitals | Axis titles |
CheyssonOutlineCaps |
Outlined caps | Decorative titles |
CheyssonTitle |
Display font | Main titles |
Two of these, CheyssonTitle and
CheyssonOutlineCaps are designed to be decorative, mainly
used in titles
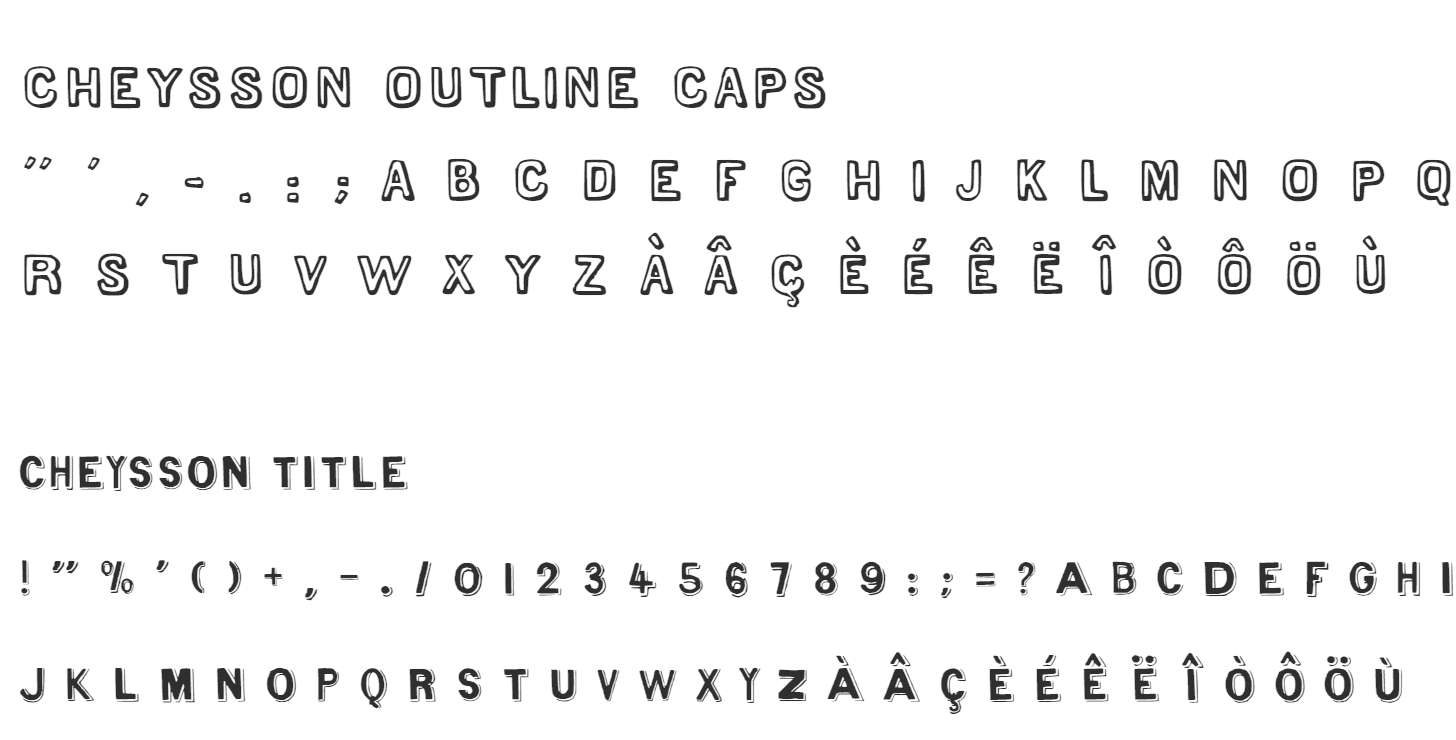
Here are the others:

To use these:
# Load fonts
load_cheysson_fonts(method = "showtext")
showtext::showtext_auto()

# View font metadata
cheysson_fonts

# Use specific fonts
theme(
  plot.title = element_text(family = "CheyssonTitle"),
  axis.title = element_text(family = "CheyssonSansCaps"),
  axis.text = element_text(family = "Cheysson")
)cheysson_palettes - Color palette specifications (25
palettes)cheysson_patterns - Pattern/hatching specifications
(134 patterns)cheysson_fonts - Font family metadata (5 fonts)albumImages - Metadata linking palettes to original
album platescheysson_pal() - Get colors from a palettescale_color_cheysson() /
scale_fill_cheysson() - ggplot2 color scaleslist_cheysson_pals() - List available palettesshow_palette() - Display a single palette with color
swatches and hex codesshow_palettes() - Display multiple palettes for
comparisonscale_cheysson() - Apply a color-and-pattern palette in
one step (experimental)cheysson_pattern() - Get pattern specificationsscale_pattern_*_cheysson() - ggpattern scales for
single properties: fills, types, angles, densitieslist_cheysson_patterns() - List available pattern
palettesshow_swatches() - Display all the swatches, or those of
chosen palettes or typesload_cheysson_fonts() - Load font familiescheysson_font() - Get font family namescheysson_fonts_available() - Check font
availabilitytheme_cheysson() - Complete Cheysson themetheme_cheysson_minimal() - Minimal varianttheme_cheysson_map() - For mapsDavid Rumsey Map Collection: Complete digitized Albums de Statistique Graphique View collection
RJ Andrews: SVG pattern extraction and digitization Classic Map Color Design | GitHub
Tom Shanley: Observable implementation Cheysson Color Palettes
Original maps from the Albums showing the variety of colors and patterns
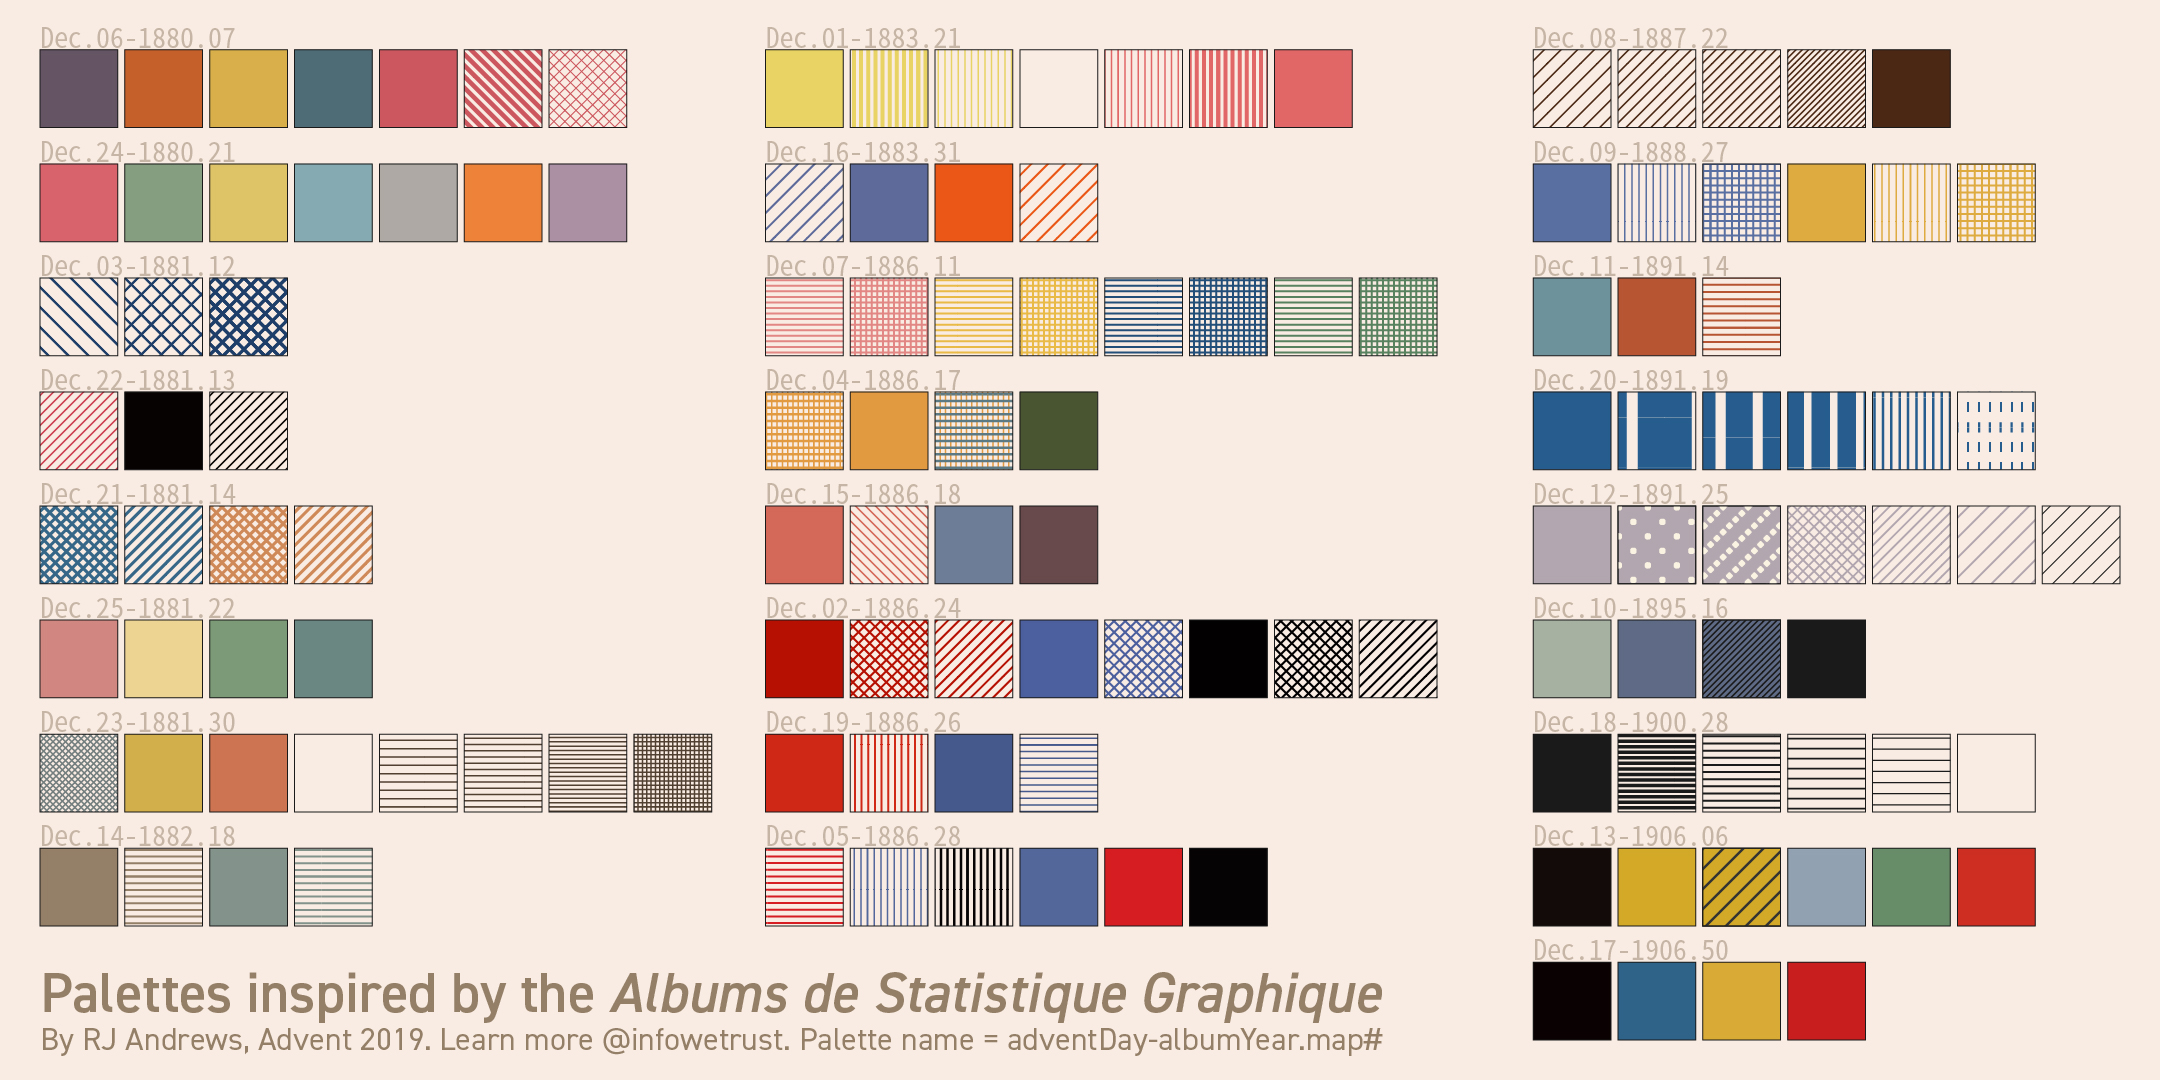
Extracted color palettes by RJ Andrews
This package is under active development. Current features are stable and tested, but the API may evolve. Feedback and contributions are welcome!
GPL (>= 3)
To cite ggCheysson, please use:
citation("ggCheysson")
#> To cite package 'ggCheysson' in publications use:
#>
#>   Friendly M (2026). _ggCheysson: Graphic Styles of Emile Cheysson for
#>   'ggplot2'_. R package version 1.2.0,
#>   <https://github.com/friendly/ggCheysson>.
#>
#> A BibTeX entry for LaTeX users is
#>
#>   @Manual{,
#>     title = {ggCheysson: Graphic Styles of Emile Cheysson for 'ggplot2'},
#>     author = {Michael Friendly},
#>     year = {2026},
#>     note = {R package version 1.2.0},
#>     url = {https://github.com/friendly/ggCheysson},
#>   }
To cite the original Albums de Statistique Graphique:
France. Ministère des travaux publics. Album de statistique graphique de [year]. Paris: Imprimerie nationale, [1879-1897].
Friendly, M. (2008). The Golden Age of Statistical Graphics. Statistical Science, 23(4), 502–535. https://doi.org/10.1214/08-STS268