![]()
![]()
![]()
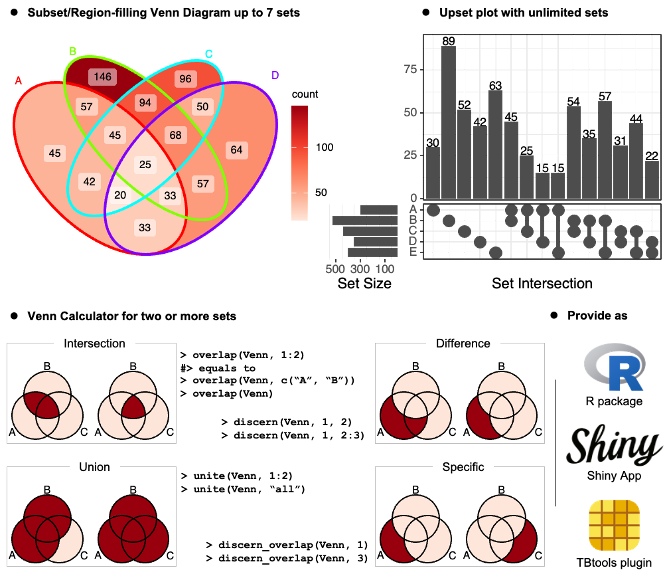
‘ggVennDiagram’ enables fancy Venn plot with 2-7 sets
and generates publication quality figure. It also support upset plot
with unlimited number of sets from version 1.4.4.
You can install the released version of ggVennDiagram from CRAN with:
install.packages("ggVennDiagram")And the development version from GitHub with:
# install.packages("devtools")
devtools::install_github("gaospecial/ggVennDiagram")If you find ggVennDiagram is useful and used it in academic papers, you may cite this package as:
Gao, C.-H., Chen, C., Akyol, T., Dușa, A., Yu, G., Cao, B., and Cai, P. (2024). ggVennDiagram: intuitive Venn diagram software extended. iMeta 3, 69. doi: 10.1002/imt2.177.
Notes
The ggVennDiagram Shiny app can be accessed at Shinyapps.io (https://bio-spring.shinyapps.io/ggVennDiagram), or
ggVennDiagram::launch_app() in local machine.
The TBtools plugin can be accessed through its plugin store.
ggVennDiagram maps the fill color of each region to
quantity, allowing us to visually observe the differences between
different parts.
library(ggVennDiagram)
genes <- paste("gene",1:1000,sep="")
set.seed(20231214)
x <- list(A=sample(genes,300),
          B=sample(genes,525),
          C=sample(genes,440),
          D=sample(genes,350))
ggVennDiagram return a ggplot object, the
fill/edge colors can be further modified with ggplot
functions.
library(ggplot2)
ggVennDiagram(x) + scale_fill_gradient(low="grey90",high = "red")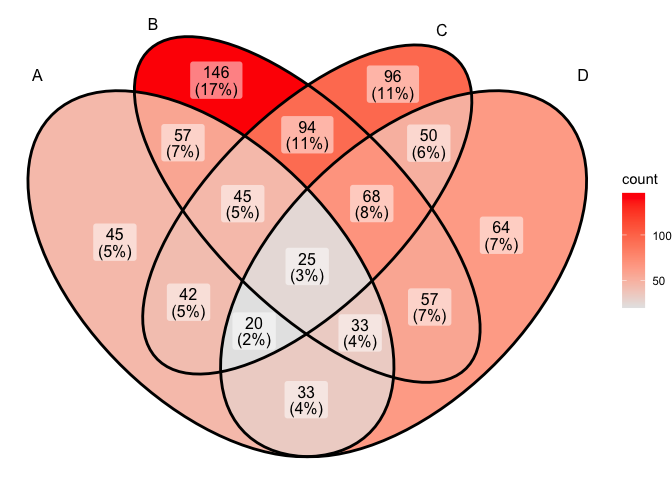
ggVennDiagram(x, set_color = c("blue","red","green","purple"))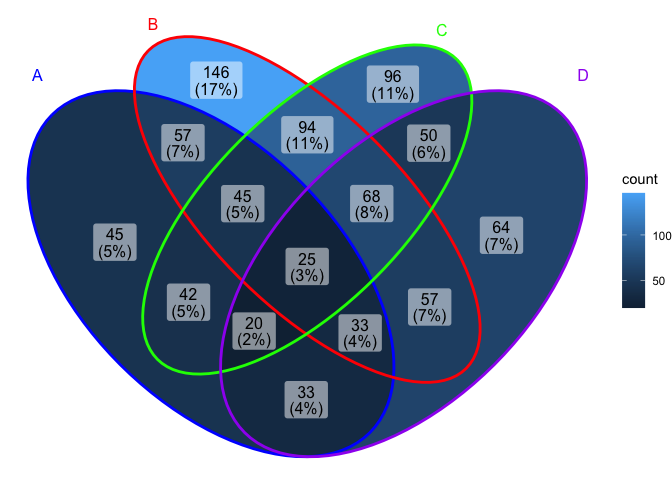
ggVennDiagram support 2-7 dimension Venn plot. The
generated figure is generally ready for publish. The main function
ggVennDiagram() will check how many items in the first
parameter and call corresponding function automatically.
The parameter category.names is set names. And the
parameter label can label how many items are included in
each parts.
ggVennDiagram(x,category.names = c("Stage 1","Stage 2","Stage 3", "Stage4"))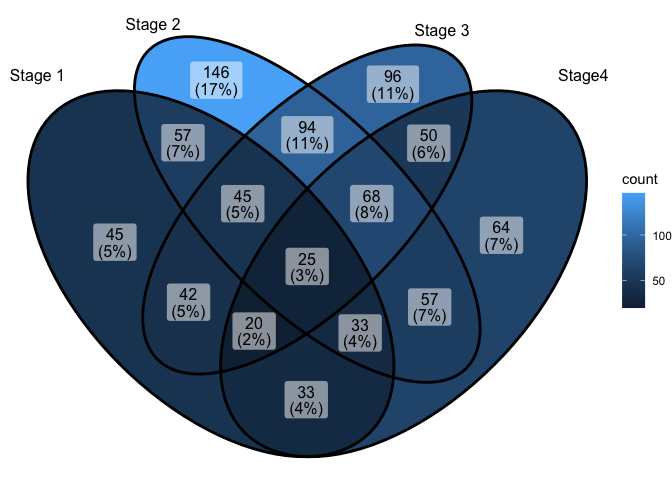
ggVennDiagram(x,category.names = c("Stage 1","Stage 2","Stage 3", "Stage4"), label = "none")
Set label_alpha = 0 to remove label background.
ggVennDiagram(x, label_alpha=0)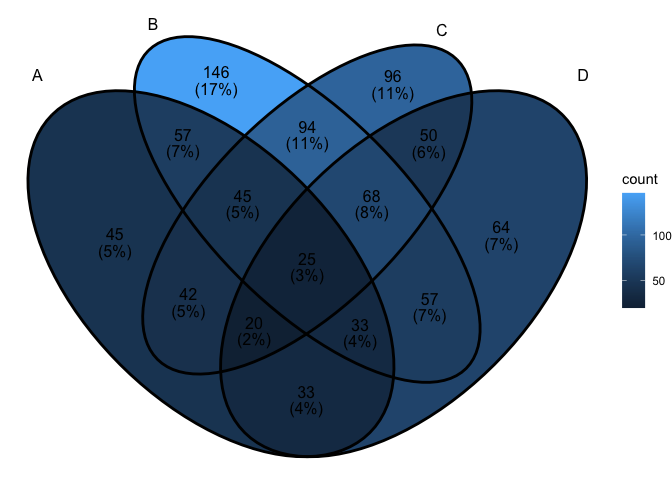
Note: you need to install the GitHub version to enable these functions.
We implemented the process_region_data() to get
intersection values.
y <- list(
  A = sample(letters, 8),
  B = sample(letters, 8),
  C = sample(letters, 8),
  D = sample(letters, 8)
)

process_region_data(Venn(y))
#> # A tibble: 15 × 4
#>    id      name    item      count
#>    <chr>   <chr>   <list>    <int>
#>  1 1       A       <chr [3]>     3
#>  2 2       B       <chr [1]>     1
#>  3 3       C       <chr [3]>     3
#>  4 4       D       <chr [0]>     0
#>  5 1/2     A/B     <chr [0]>     0
#>  6 1/3     A/C     <chr [1]>     1
#>  7 1/4     A/D     <chr [2]>     2
#>  8 2/3     B/C     <chr [1]>     1
#>  9 2/4     B/D     <chr [3]>     3
#> 10 3/4     C/D     <chr [1]>     1
#> 11 1/2/3   A/B/C   <chr [1]>     1
#> 12 1/2/4   A/B/D   <chr [1]>     1
#> 13 1/3/4   A/C/D   <chr [0]>     0
#> 14 2/3/4   B/C/D   <chr [1]>     1
#> 15 1/2/3/4 A/B/C/D <chr [0]>     0
If only several items were included, intersections may also be viewed
interactively by plotly method (if you have two many items,
this is useless).
ggVennDiagram(y, show_intersect = TRUE)In web browser or RStudio, you will get:
There are three components in a Venn plot: 1) the set labels; 2) the
edge of sets; and 3) the filling regions and labels (optional) of each
parts. We separately stored these data in a structured
VennPlotData object, in which labels, edges and regions are
stored as data frames.
In general, ggVennDiagram() plot a Venn in three
steps:
shapes datasets.VennPlotData object that
includes all necessary definitions. We implement a number of set
operations functions to do this job.ggplot2 functions.Please check
vignette("fully-customed", package = "ggVennDiagram") for
more information.
If you have reviewed my codes, you may find it is easy to support Venn Diagram for more than four sets, as soon as you find a ideal parameter to generate more circles or ellipses in the plot. The key point is to let the generated ellipses have exactly one intersection for each combination.
From v1.0, ggVennDiagram can plot up to seven dimension
Venn plot. Please note that the shapes for this five sets diagram, as
well as those for six and seven sets, are imported from the original
package venn
authored by Adrian Dușa.
However, Venn Diagram for more than four sets may be meaningless in some conditions, as some parts may be omitted in such ellipses. Therefore, it is only useful in specific conditions. For example, if the set intersection of all group are extremely large, you may use several ellipses to draw a “flower” to show that.
x <- list(A=sample(genes,300),
          B=sample(genes,525),
          C=sample(genes,440),
          D=sample(genes,350),
          E=sample(genes,200),
          F=sample(genes,150),
          G=sample(genes,100))

# two dimension Venn plot
ggVennDiagram(x[1:2],label = "none")

# three dimension Venn plot
ggVennDiagram(x[1:3],label = "none")

# four dimension Venn plot
ggVennDiagram(x[1:4],label = "none")

# five dimension Venn plot
ggVennDiagram(x[1:5],label = "none")

# six dimension Venn plot
ggVennDiagram(x[1:6],label = "none")

# seven dimension Venn plot
ggVennDiagram(x,label = "none")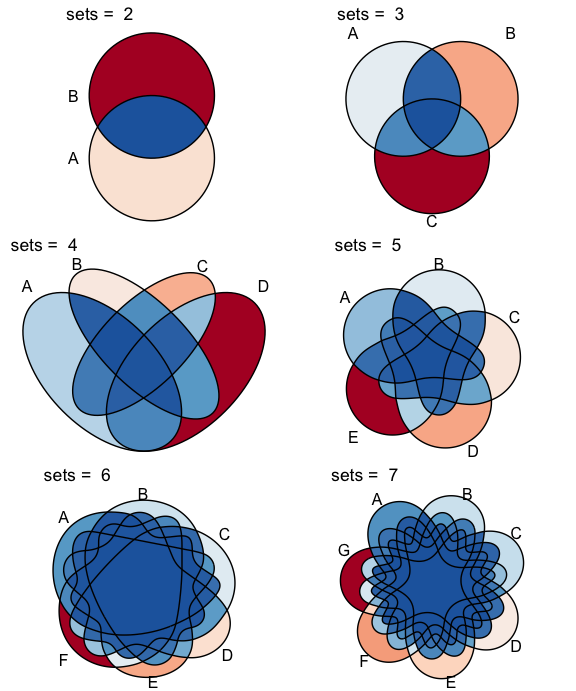
From version 1.4.4, ggVennDiagram supports unlimited
number of sets, as it can draw a plain upset plot automatically when
number of sets is more than 7.
# add an extra member in list
x$H = sample(genes,500)
ggVennDiagram(x)
#> Warning in ggVennDiagram(x): Only support 2-7 dimension Venn diagram. Will give
#> a plain upset plot instead.
#> Warning: Removed 1 row containing missing values or values outside the scale range
#> (`geom_col()`).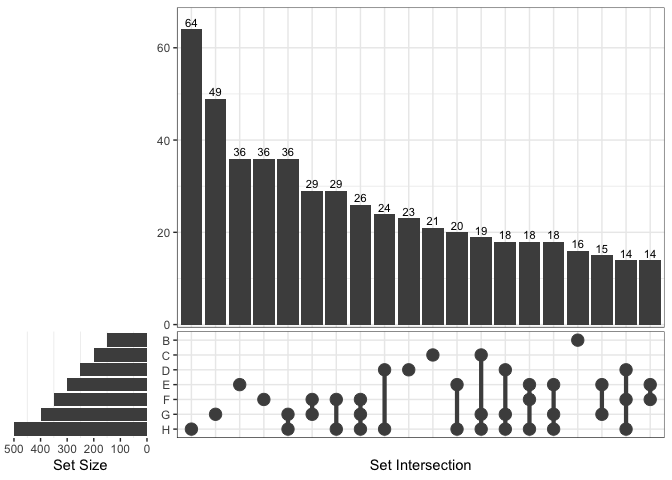
Upset plot can also be used by setting
force_upset = TRUE.
ggVennDiagram(x[1:4], force_upset = TRUE, order.set.by = "name", order.intersect.by = "none")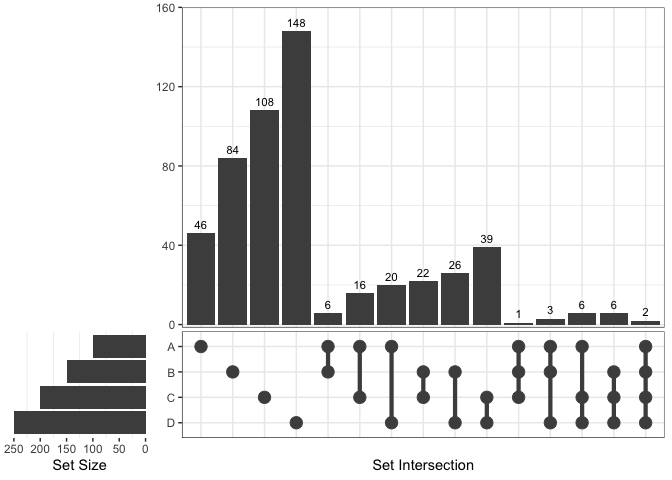
Since upset plot is consisted with upper panel and lower panel, and
left panel and right panel, the appearance should be adjusted with
different conditions. We provide two parameters, which are
relative_height and relative_width to do
this.
For example, if we want to give more space to lower panel, just
change the relative_height from 3 (the default) to 2.
venn = Venn(x)
plot_upset(venn, nintersects = 30, relative_height = 2, relative_width = 0.3)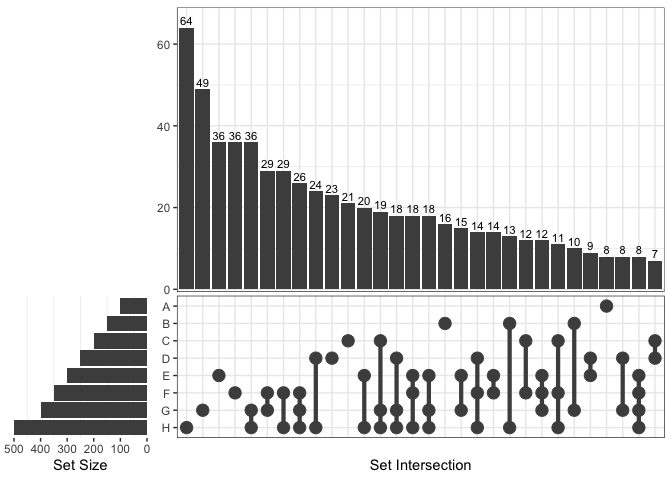
Adrian Dușa (2024) venn: Draw Venn Diagrams, R package version 1.12. https://CRAN.R-project.org/package=venn.